Free Week Stock Markets Forecasts
We provide professional newsletter analytics by paid subscription, and for the foreseeable future we are showcasing our approach(s) to financial markets analysis investment and trading by featuring sample free forecasts of the markets as measured by S&P500 (^GSPC) and large CAPs Oracle corporation (ORCL) and or MicroSoft Corporation (MSFT) weekly or more frequent forecasts, as is most convenient...
Disclaimer: We request that you review NASDAQ and CBOE risks associated with stock markets and options markets investing.
News News News!!! We have begun automating our website, to provide you with do-it-yourself analysis, charts graphs and technical analysis and indicators. We utilize the 'carat' stock symbol convention of finance.yahoo.com with ^GSPC (S&P500, etc. ) and ^VIX (volatility index, etc.) indices and the usual stock ticker symbols e..x MSFT (Microsoft) ...Note the 'carat' and alternative for index symbols, if you can't use the stock or index symbol on yahoo finance, you probably can't use it on our website.
Free Stock Chart Analytics (For Free)...Click To View All Indicators - view
Subscribe to Our Newsletter 'Updates' For Free!
Dear Readers...are you interested in receiving 'updates' delivered to your email box for free????
If you receive benefit from our free forecasts, and you would like to be notified as updates are posted on the free portion of our newsletter, then subscribe simply by filling out our subscriber email form, select from the menu to the left
If you receive benefit from our free forecasts, and you would like to be notified as updates are posted on the free portion of our newsletter, then subscribe simply by filling out our subscriber email form, select from the menu to the left
Update of our LTR long term risk of corrections/crashes 17April2014.
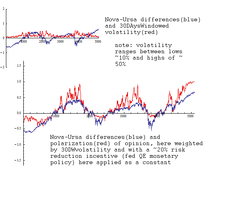
Fig.1. is the graph f the ExcessDemand theory of markets (Michael et. al. 2002, Chowdhury-Dabshih 1998) with data of the RYDEX funds' NOVA/URSA or Bull/Bear funds, literally voting by dollars! The mismatch between dollars invested in the bullish NOVA fund and the bearish URSA fund is a measure of excess demand, sentiment, confidence and of polarization. Market analysts have utilized the ratio of ursa/nova to estimate this effect of investor confidence before as by moving averages to time peaks (google it!), however we utilize this data as input into the full many-particle physics theory of phase transitions, as we also utilize CBOE put/call options (derivatives), the SVXY/UVXY data sets of prices of ETFs, and as similarly any sentiment and excess demand data set inclusive of investor confidence bull/bear ratios and 2nd tier bid/ask spreads and ratios/differences can be utilized...other data sets utilized can be any consumer confidence (bull/bear) data and proportionately any opposing sets of data relevant to a asset here the full S&P500 and the US economy and noting the increased correlation globally by indices and their economies with the US indices and economy reported elsewhere occurring at higher or increasing levels since the year ~2000...
The Blue line is the nova-ursa differences rescaled for visualization to unity, and the red line is the volatility weighted (variance<->Temperature for physicists) ExcessDemand curve graph, this shifted by perturbation by fed monetary policy of interest rates adjustments and QE bond purchase programs as a driving magnetic field like force a-periodic in nature (highest incentives at market bottoms to stimulate recoveries and lowest at market tops to curb bubbles inflation speculation etc..)...This shifts the red line up from symmetric to asymmetric and contributes significantly to the ExcessDemand by markets' investors.
This ExcessDemand then nears +1 at market tops just before a crash ( a large correction if you will) and reduces to near zero -0.2 to -0.3 just as a market bottom following an extended crash or meltdown has occurred...
The graphs are of ~15years and ~5000 trading days, with the recent S&P500 ~50% crash of 2008 lasting ~1year the large draw down bottoming at days '~3800' in 2009 and the preceding ~2000 three year ~3years crash bottoming in days'~2300'.
We note that any bull/bear demand/supply data ED graph for any asset or index or economic market should first be rescaled to unity prior to its input to the excess demand theory, this assuring consistent multi-scale magnitude effects of demand/supply scale well with their volatilities at unity scaling for any range and any asset.
Forecast 127 : 20October2013-27October2013
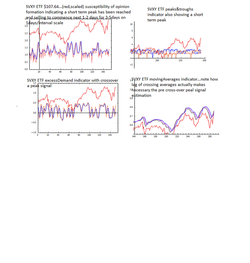
svxy ETF 1days/interval or short term at $107.64...see previous long term forecast for weeklys..indicators are proprietary probabilistic...forecast is for selling to commence next 1-2 days for 3-5 trading days for +/- stdDeviation of recent moving averages or ~10%...
Forecast 126.5 : 15Oct2013
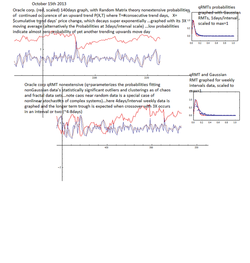
the ORCL oracle corp. (red, scaled) ~$33 by
q-parameterized nonextensive probability of random matrix theory...meaning is the very random stock market is by our math very accurately measured (see insets graphs of P(X,T) ) and therefore measuring the probability of a trend occuring AND its reversal probability is >95% accurate...remaining task is for you the investor to portfolio your risk accordingly...see graphs of short term and weekly scales for forecasts.
q-parameterized nonextensive probability of random matrix theory...meaning is the very random stock market is by our math very accurately measured (see insets graphs of P(X,T) ) and therefore measuring the probability of a trend occuring AND its reversal probability is >95% accurate...remaining task is for you the investor to portfolio your risk accordingly...see graphs of short term and weekly scales for forecasts.
Forecast 126L: 08October2013-18October2013
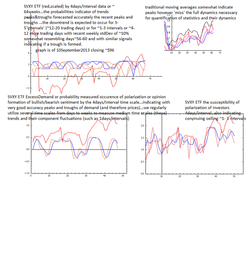
For a change to show our ability top track market wide statistical dynamics we
showcase our proprietary indicators applied to SVXY ETF as derived from VIX
volatility index of the S&P500...here graphs are of 4days/interval prices
data...see graphs and insets for explanations and forecasts.
showcase our proprietary indicators applied to SVXY ETF as derived from VIX
volatility index of the S&P500...here graphs are of 4days/interval prices
data...see graphs and insets for explanations and forecasts.
Forecast 126
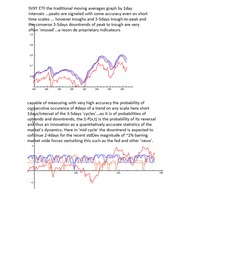
For a change to show our ability to track market wide statistical dynamics we
showcase our proprietary indicators applied to SVXY ETF as derived from VIX
volatility index of the S&P500...here graphs are of 1days/interval prices
data...see graphs and insets for explanations and forecasts.
showcase our proprietary indicators applied to SVXY ETF as derived from VIX
volatility index of the S&P500...here graphs are of 1days/interval prices
data...see graphs and insets for explanations and forecasts.
Forecast 126L 03Oct2013-
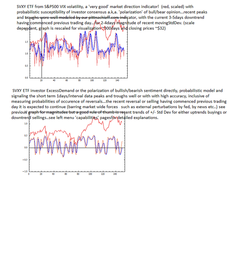
For a change to show our ability top track market wide statistical dynamics we showcase our proprietary indicators applied to SVXY ETF as derived from VIX volatility index of the S&P500...here graphs are of 1days/interval prices data...see graphs and insets for explanations and forecasts.
Forecast 125:30Sept2013-07Oct2013
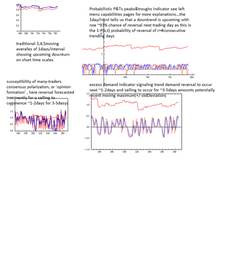
Oracle prices and short term forecasts of the 3-5days trough to peak and its converses...several of our proprietary indicators are showcased. See graphs and insets for explanations click on the graphs and zoom out.
Forecast 124: 05August2013-26August2013
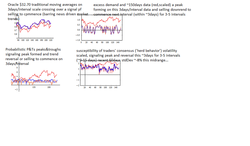
Oracle $32.59 closing Fri 02Aug2013 ...the graphs are proprietary indicators by Pittnachioff.com , of 3days/interval data of demand/supply probabilities P&T, of susceptibility of trending consensus or 'herding' behavior (we prefer the term consensus), and compared with traditional moving averages indicator...all are signaling a midterm peak to be followed by reversal or selling next ~3days of trading for ~9-15 days or 3-5intervals and with magnitude of recent 20daysX3~60days moving stdDeviation of +/-10% ...within this midterm are fluctuations of short term stochastics of 3-5days (actually trading days) , which as you know have recently whipsawed yet trended upwards towards the options expirey expectation of traders towards $33.00 price target by Sept-Oct, and by valuation as a perception that recent selling of ORCL was an overreaction to market performance expectations as earnings were along estimates....NOTE this has to be balanced against market wide forces of news driven desire to rally on perceived economic growth data, and fed qe easing or bond buying and its forecasted tapering this Sept-Oct... our advice is to take a look at options expirey and how often actual price pinned to the expected price, and trade accordingly whilst being hedged if a long term trader, or if a short timing trader to take a look at our forecasted timing record (quite high in accuracy!) and order our software or subscribe or merely take afvantage of our free forecasts.
forecast 126: 27July-05August2013
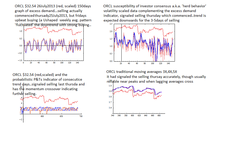
Oracle prices data forecasts short term, by proprietary indicators at Pittnachioff.com ...this is an update see recent forecasts for longer term forecasts and trends. Forecast is selling 3-5days which began last thursaday shallowly but was interrupted by friday's end of the week buying, and selling to continue today monday, mafmnitudes recent +/-stdDev..
Forecast 125: 22July2013-
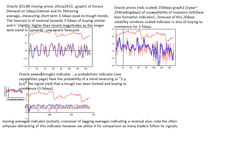
ORCL short term forecasts, a trough was formed and buying is expected to commence for 3-5days ~22July2013...see previous recent forecasts for longer term.
Forecast 124: 18July2013-25July2013
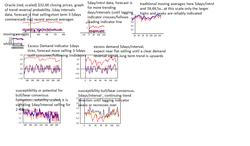
Oracle closing prices ~$32.00 (before close) and graphs of proprietary indicators at 1day and 5day per inerval (tick) data, forecasts of short term cycles that occur on 3-5days trough to peak and longer term cycles that occur on 3-5 'intervals' from trough to peak (see graphs)...
forecast is selling commenced today and is expected to occur for 3-5days however expected to be shallow until market direction and the demand for ORCL stock and expectations of it reaching ~$33.00 within ~20days as per options expirey (not shown here) spread vie. On longer time scales the uptrend is expected to continue for 1-3 intervals ~5-15 days until the lagging indicator rolls over or crosses the leading indicator... SEE ZOOM OUT VIEW NEXT
forecast is selling commenced today and is expected to occur for 3-5days however expected to be shallow until market direction and the demand for ORCL stock and expectations of it reaching ~$33.00 within ~20days as per options expirey (not shown here) spread vie. On longer time scales the uptrend is expected to continue for 1-3 intervals ~5-15 days until the lagging indicator rolls over or crosses the leading indicator... SEE ZOOM OUT VIEW NEXT
zoom out views
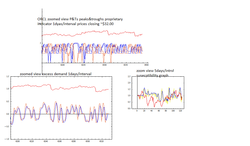
selected zoom out views ORCL forecasted by out selected indicators
Forecast 122 : 03July-11July2013
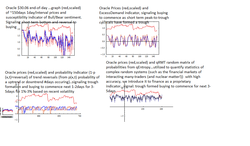
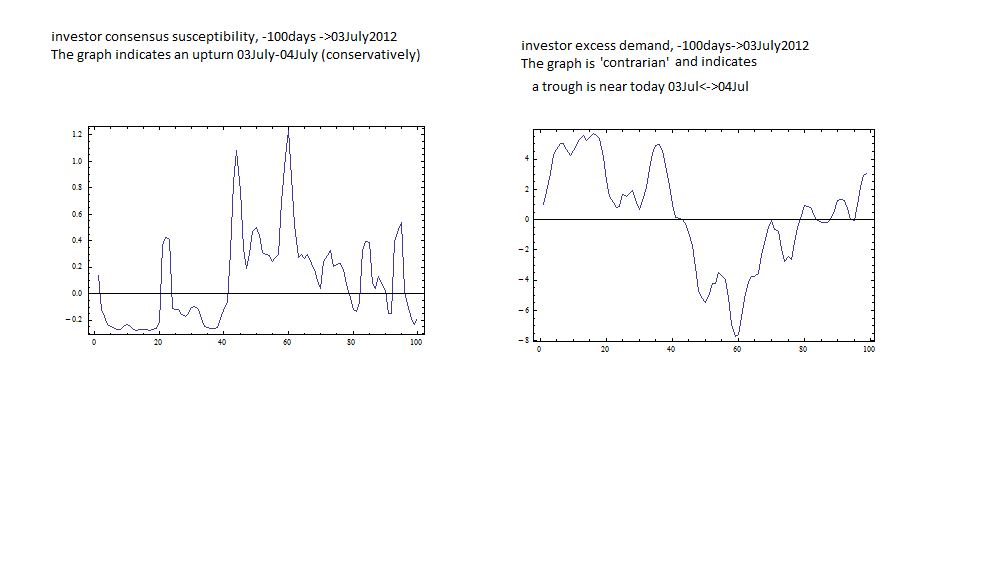
Oracle prices closing $30.70 ...we show several of our proprietary indicators. Graph1 is the Bull/Bear consensus formation, indicating more buying potential, and from graph2 Excess Demand with a similar forecast however measuring demand strength or bias...Graph3 is our probability of occurence of trends AND their probability of reversal! forecast is additional 1-2 days of trading buying before a short term peak is formed and recersal occurs...see graphs for details and comments. Graph4 is the qRMT random matrix theory probability and its momentumm also in agreement with additional buying before peak on this short term scale of 1days/interval occurs and selling commences. Magnitudes are recent averages which for ORCL stock recently off of its sharp drop are ranging from ~2%-4% per peak-to-trough, lasting 3-5days per.
Note: for explanations of the math behind these probabilistic proprietary indicators (patents filed), see "capabilities" pages menu left.
Note: for explanations of the math behind these probabilistic proprietary indicators (patents filed), see "capabilities" pages menu left.
Forecast 121: 24June2013-01July2013
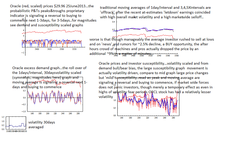
Oracle inc. prices $29.96 closing and several of our proprietary indicators that utilize probability AND momentum with volatility to accurately model the statistical dynamics of markets here focused on ORCL stock prices though we analyze overall markets and indices elsewhere(menu left, we update this sporadically). The statistics of a time series of prices of real markets stocks you will note follows a 'superdiffusion' that only recently 2002 was modeled fully (by us , published Physica A) thus allowing us to accurately model the uncertainties of randomness in prices. Also we show case the interactions-traders model of Excess demand and the susceptibility of bull/bear consensus graphs3,4.
forec. 121 continued
Oracle prices $29.96 and our proprietary probabilistic indicators (that is why we showcase them for 'free', we are seeking subscribership clientele)...along with introducing nonextensive statistics describing superdiffusive processes such as markets stocks prices , we also coauthored the qRMT random matrix theory qEntropy nonextensive statistical ensembles Wogner statistics...in the 1950's developed tpo describe complex interactions in nuclear matter (approximately), we make it precise in accuracy of quantifying uncertainty...therefore yet again we have developed the qRMT indicator graph1 here shown with scaled price data for dynamical 1says/interval forecast. See recent forecasts for more details and long term forecasts of weeks to months. Also note that we are automating this service, visit us soon for client-side free web site analytics software.
Forecast 120: 13June2013-21June2013
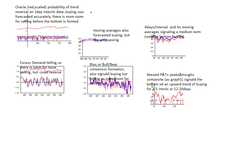
Oracle $34.25 13June2013 closing price...the selling today was forecasted accurately, and the proprietary indicators are telling us more room for selling exists on 1day interval data, and the weekly scale of interavls of 4days/interval is however telling us that a bottom has been formed and buying is about to commence for 3-5intervals or ~20days.
So how does this work... the fluctuations on 1days time scale is 3-5days of peak to trough and again 3-5 days trough to peak... this is 'embedded' in the longer time scales of 'visually' self-similar fluctuations of 3-5intervals of 4days/interval and so forth, and therefore as the uptrend long term commences there will be fluctuations of selling downwards along the uptrend...Add to this the well know (published elsewhere by other authors) options expiry 21June2013 positions around $34.50 'pull' upwards and we expect a short selling cycle today 14June2013 through possibly tuesday though a shallow selling to be followed by buying towards the pin the price on the options by next friday... this unless a major market downturn occurs as occasionally happens to trend ORCL prices downwards with the S&P500. And note further that the expectation by options next month 21July2013 is yet between $34.50 ~ $3
So how does this work... the fluctuations on 1days time scale is 3-5days of peak to trough and again 3-5 days trough to peak... this is 'embedded' in the longer time scales of 'visually' self-similar fluctuations of 3-5intervals of 4days/interval and so forth, and therefore as the uptrend long term commences there will be fluctuations of selling downwards along the uptrend...Add to this the well know (published elsewhere by other authors) options expiry 21June2013 positions around $34.50 'pull' upwards and we expect a short selling cycle today 14June2013 through possibly tuesday though a shallow selling to be followed by buying towards the pin the price on the options by next friday... this unless a major market downturn occurs as occasionally happens to trend ORCL prices downwards with the S&P500. And note further that the expectation by options next month 21July2013 is yet between $34.50 ~ $3
Forecast 118: 03June2013-10June2013
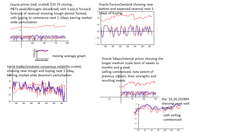
Oracle prices $33.78 ...the several proprietary indicators are graphed, signals are for buying to commence in ORCL stock as early as monday 03June2013 for 3-5days, and with longer term trends a selling for 10-25days to commence following... yet interspersed with downtrending 3-5day fluctuations...see next qRMT set of graphs.
forecast 118: continued
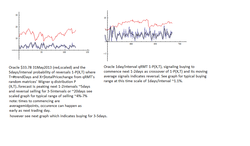
Oracle $33.78 indicators gra[hed are qRMT random matrices' probabilities..see graphs for details and menu left 'capabilities' for further info. Forecast is buying to commence for 3-5days for ~1.1%, and selling downrending long term forecast a selling downtrend with its own 3-5day fluctuations to commence following and for 15-25days.
Forecast 117 24May2013weekend
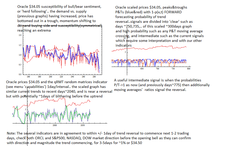
Oracle $34.05 buying signaled to commence next trading day by excess demand and susceptibility but P&Ts peaks&troughs probabilities have yet to show a trough formed, this last indicating the potential for fluctuations during the upcoming uptrend buying as a 'true bottom' of the trough is formed.
Forecast 117 24May2013weekend
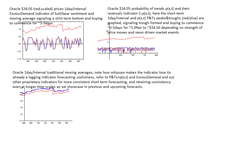
Oracle 24May2013 closed at $24.05, signals from several of our proprietary indicators were that buying was to commence within 1-2 trading days depending on indicator and for 3-5days until next peak...here qRMT random matrices theory , which we coauthored and published in 2001,2002 and which quantify nonlinear statistics of complex systems such as many interacting traders markets with very high accuracy, see menu left 'capabilities' page...
Forecast 116: 21May2013-28May2013
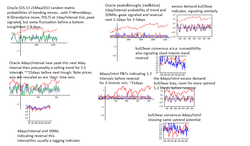
Oracle $35.13 closing prices (red, scaled) graphed scaled for visualization...We present our proprietary indicators which are capable of quantifying the complex statistics (nonlinear stochastics) of markets. We utilize random matrix theory, interacting traders models and derive a) bull/bear sentiment excess demand b) susceptibility of investors to follow trends or consensus c) highly accurate forward probability forecasts of trend reversals.
We present 1day ticks and 4days/interval prices data statistics and the forecasts associated. For explanations and details see the graphs insets and the menu left 'capabilities' section for more details. Also we are in the process of automating the client side of our web presence and you can expect to be able to perform similar analytics in the coming months.
We present 1day ticks and 4days/interval prices data statistics and the forecasts associated. For explanations and details see the graphs insets and the menu left 'capabilities' section for more details. Also we are in the process of automating the client side of our web presence and you can expect to be able to perform similar analytics in the coming months.
Forecast 114: 06May2013-13may2013
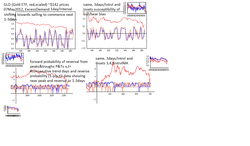
Oracle prices (red,scaled) and probabilistic forecasting...we utilize the recently created advanced 'super-statistics' in mathematics to correctly quantify occurence of events...this allows us to derive indicators based fully on these statistics (qRandom Matrices AND nonextensive statistics) that make it possible to forecast trends and trend reversals in a)prices b) demand c) sentiment... quantifying such probabilities along the way. See graphs for forecasts and menu left for details.
Forecast 113: 29April2013-05May2013
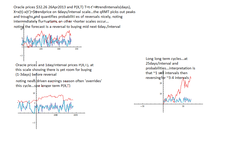
Oracle $32.26 prices close (red, scaled)...the probabilistic proprietary inicator P(X,T) X=$prices toral of trend T=#consecutive days in trend...graphed at several #days/interval for different scales' self-similar fluctuations' probabilities of occurence of short, medium and long term trends...and given that P(X,T) is a quantifier of probability of occurence of a trend, its remainder 1-P(X,T) is the probability of a reversal of a trend!! All this scheme needs is precise probabilities to make it a risk calculator...we claim this Random Matrix Theory nonextensive statistics probabilistic proprietary indicator is just that! See our menu left 'capabilities' pages for more details and our other indicators. For more trends and forecasts, read more in the previous week's forecasts and discussions.
Forecast 112: 22April2013-29April2014
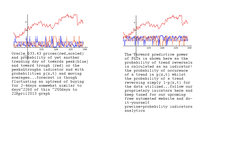
Oracle prices (red, scaled) $32.43closing...the graphs are of the consecutive trending days of 'peaks&troughs', as inputs to the probability of occurence of such consecutive trend days, and note the probability of more trend days decay near-exponentially...as these are probabilities, the 1-p(x,t) is the probability of a reversal of the trend, thus we are able to dynamically quantify the forward forecasted probability of changes in the market stocks here Oracle...see graphs for explanations and the short term forecasts, and scroll down for longer term forecasts and by other probabilistic methods.
Forecast 112 continued
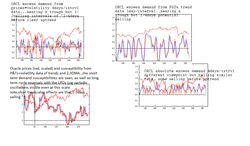
Interaction between traders with their own bias of bullish or bearish sentiment produces excess demand or supply, this proportional with market depth to the changes in prices...we utilize prices data, sentiment data and trend strength data as input for our ExcessDemand theory of market dynamics...here we graph several of these utilizing various time windows. See menu left 'capabilities' and the graphs for details and current forecasts by this method.
Correction to graph 2(top right): the forecast should read '...of buying before peak is formed on this 1day.interval', or as the ExcessDemand moving average line crosses over.
Correction to graph 2(top right): the forecast should read '...of buying before peak is formed on this 1day.interval', or as the ExcessDemand moving average line crosses over.
Forecast 113: 29April2013-05May2013
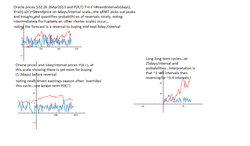
Oracle prices $32.26 closing (red, scaled) and the P(X,T) probability of trend occurence with T=#trend days and X=$trend cumulative prices...the qRMT random matrix theory P(X,T) is a very accurate statistics for complexity and interacting random systems such as economics markets and traders behavior ...see menu left 'capabilities' and scroll thrpugh previous forecasts for details...
Notes: the forecast for ORCL is selling 1-2 days, buying to commence on longer trends next few days see the graphs explanatory details an previous forecasts...These 1days/interval are often overriden or shifted by market wide forces as are longer ~8days/interval say by earnings reports and so on...so let us update you by discussing briefly market wide forces currently affecting us.
The S&P500 is a good measure of economics...it is supposedly 'difficult' to track however we showed several months ago that by our P(X,T) and P&Ts+p(x,t) our very precise probabilistic indicators that even weighted averages such as S&P500 whose characteristics we were the first to fully explain in 2002, is easily forecasted and risk quantified for further risk-reward portfolio optimization...we will present our LTRs long term risk updates next few days. In the meanwhile we note that the S&P500's VIX volatility derived ETFs are actually an even better indicator of market direction! To summarize, the bullish trend forecast by such indicators has now been revised and a reversal is forecasted imminent, with UVXY inverse(to S&P500 directly proportional to VIX) ETF price objectives of 13.0 now ~6.41, of SVXY directly proportional (to S&P500 and inversely to VIX) ETF to 69.0 now ~87.21...thus VIX volatility which inversely tracks S&P500 now at ~13.5 which drops when bullish consensus dominates, is expected at high levels soon... its ETFs UVXY up and SVXY down are inications of price dropping in the S&P500 itself expected at pre recent highs
Forecast 112 continued
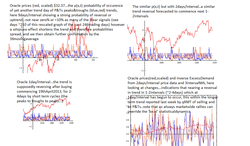
As a reference for short time scale dynamical evolution we graph the prices and probabilities from 19April2012...these are to be compared with today's data and graphs
Forecast 112 continued
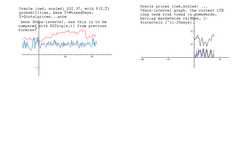
Oracle prices 19th April2012 and our qRMT q-parameterized random matrix theory P(X,T) T=#consecutive trend days X=$totaltrendprice...we graph the short term and long term price trends here...see graphs for details and forecasts, and for an introduction to the theory see the menu left 'capabilities' and read through some previous forecasts.
Forecast 111: 16April2013-22April2013
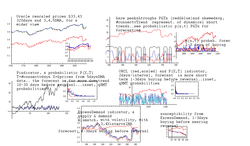
Oracle (red, scaled) prices $33.43 and several indicators with a forecast for the short term trend...for longer trends see menu left 'LTRs' section, our recent forecasts, and or subscribe!
We forecasts several days of buying of Oracle stock, followed by the short reversal of the 3-5days peak to trough type. For longer term LTRs risk, we forecast selling of Oracle stock lasting ~2-6intervals of 5days/interval before the long term fluctuations reverse to the upside.
Market wide, a selloff or correction had been forecasted by us as by others as about to occur, it recently has begun to show signs of occuring, with last week ~2.4% buying at peaks giving way to gold dropping with GLD an indicator dropping ~15%,, S&P500 dropping %2 on monday, then rebounding about that on tuesday, and as we write this on 17April2013, redropping ~1.5% heading lower, with volatility VIX at ~16.3, UVXY inverse S&P500 ETF at ~7.8 up ~10% and SVXY correlated with S&P500 at ~94 down ~6% and dropping...directionality for the markets is then requested...well, volatility reversion to mean told us a few weeks ago a correction is upcoming (see menu LTRs and recent and previous forecasts), with even if this a technical correction of about ~4% and if to be rebounded as seems likely by qe quarterly easing a large correction move to the downside is forecasted at the latest to increase in probability by the spring doldrums when high volumes of shares trading hands 'winds' no longer help fill the sails of the market and the rebalancing between real market worth, economic realities and risk appetite (volume) is weighed against qe and its bolstering effects,AND as the 4-6 years crash cycle known about since early 1900's , and which recently 2007 lost ~50% of the S&P500 value is forecasted to hit.
Forecasts have been for S&P500 to climb yet higher, to ~1800 price targets, for Vix to decline to bullish certainty of ~8, of UVXY to drop to ~6.49 which was then revised to ~3.4...these meaning a bull market continuing into summer...QE quantitative easing may yet drive this market higher if real economic recovery is higher than expected....However the two factors of i) 4-6years crashes ii) Gold market turning into an analysts call of Bear market and selling off may yet cause it to falter, with the other factors of iii) large may-june months volume drop, iv) economic factors triggering the selloff at bull sentiment highs as has been shown to occur in previous crashes (meaning larger than correction). We personally feel it can occur as soon as this week (low probab.) and as late as late summer (high probab.) this last likely as post World War II -like economic patterns repeat themselves and with the 4-6year cycle shifting out of phase or being delayed by government programs meant to stimulate the economy.
Forecast 109: 08April2013-16April2013

Oracle prices $32.36 (red, scaled) and P(X,T) qRMT probabilistic random matrix theory quantifier of probability of occurences of T=#consecutive days of a trend X=$additive cumulative prices , with 3days and 8days intervals...
The trend is expected upwards following market forces driven higher by several factors such as fed quantitative easing and seasonal risk appetite pre spring low volumes and potential sell offs.... this expected after the recent selloff in ORCL which coincided ~90days cyclicals with a near estimates 'letdown' earnings report. Expect 3-5days peak-to-trough cyclicals to continue with an upwards trend continuing towards spring.
For market wide analytics see LTRs previous forecasts and menu left and stay tuned for our free forecasts. Summary: We are yet looking at 4-6 year cycles of very large market wide corrections, these recently in 2007-2008 had a ~50% losses of S&P500... we note the crash or meltdown occurs at very low volatility as bullish consensus dominates right up to the crash...this time however qe quantitative easing is driving markets higher (simplified) adding to a lowering of uncertainty or volatility which has already gone lower than precrash2007 levels (see our many forecasts for further discussion)...with volatility as measured by VIX expected to drop to ~8-9 before reversing equivalently the ETF UVXY at ~6.5 (currently 7.1!!) expected before reversing, will this be the pre corrective or crash peak? stay tuned next several weeks as we discuss this in our weekly (or more frequent) newsletter and free forecasts or subscribe for greater access and information.
Forecast 01April2013-09April2013
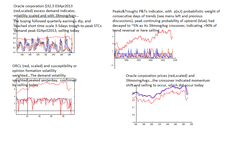
Oracle prices 03April2013 $32.45... The recent dip in price due to earnings let down was bought into, and regular fluctuations that occur 3-5days trough-peak resumed or are assumed to resume with selling at forecasted peak having occured today...the several proprietary indicators (from physics based phase transitions like theoretical approaches) are graphed along with inset explanations. For more market wide analysis continue reading the below forecasts next graph down. For details of the probabilistic models see menu left 'capabilities' and 'LTRs'.
Forecast 01April2013-03April13
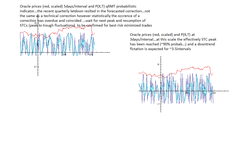
Oracle prices (red, scaled) closing $32.54 01Aprl2013,$32.74 02Aprl2013...the trend after recent 'disappointing' earnings reports quarterlies which dropped the price from $36.50 to $31.00 was upwards as the price dip was bought into... statistically the uptrend towards a short term peak is at T=3-5days from lows depending on X=strength of price changes as P(X,T), the qRMT random matrix theory probability distribution indicator 'Pindicator' (our proprietary model marketing name...see menu left 'capabilities' for more descriptions) which is expected ~90% probability pf prices to reverse or that it has reached a short term peak... that said, the last ~10% is a small yet significant probability of occurence, and as today proved by continued buying to $32.74... expect short term cycles to resume with fluctuations downwards next 1-3days barring market wide rallying news driven forces. This can however be overriden by market wide and or news driven forces as we discuss next., this can be modeled easily by longer intervals say 5days/interval data with focus on longer statistical intervals which yet describe even such market wide effects see our discussions also previous forecasts and meus left. In fact long term effects become so easily modeled that traditional moving averages, bands, points&figures become very good at forecasting...it is at higher frequencies such as we cover here, AND the interactions dynamics of corrections and crashes AND the precise quantification of statistical probability of market risk movement direction and dynamics of bias and or excess demand that sets our recently developed theoretical physics of complex and random systems AND qRMT random matrix theory methods apart from the rest as we provide the most precise quantitatification of risk by our proprietary indicators.
Note: the trend market wide is upwards by market forces as S&P500 (for example) rally expected until spring, pulling ORCL prices upwards with it.
The S&P500 itself free of earnings surprises, it continues to rally, driven by economic news, risk appetite, irrational exuberance, and of very importance fed intervention....it having rallied early in the first half of the year as in 2011,2012, it is expected to drop in the spring to summer low volume periods, even more than the expected correction which was forecasted for march-april but which was perturbed or quenched out by QE driven rallying. The S&P500 price target by trends is several hundreds of points above current highs, which above the all time highs of 2007 were recently broken through 4th week March in 2013....if one looks at the volatility index VIX inversely correlated with S&P500, one sees it at all time lows of ~12, and expected to go lower yet....its ETFs UVXY ~7.43 which is also inversely correlated with S&P500 (and SVXY nonlinealry directly with S&P500 or inverse to VIX) are expected to continue in the rally direction, with UVXY( currently ~7.43) expected at ridiculously low levels of 6.49 and SVXY(~93) at 109 or VIX(~12) of 7-9!!!! meaning uncertainty in markets almost nonexistent, meaning consensus at high bullish sentiment, a recipe for disaster of panic driven first-to-sell in usual free market economies.....
The market is not free however...it stopped being free when the regulating agencies began to manipulate the markets with the recent quantitative easing by the fed acting as a money pump (printed as deemed required) striking the cyclically fluctuating market dynamics on a monthly regular periodic driving timing. This isn't a mathematically precise thing the fed is doing, say responding with optimized stochastic feedback control at SR stochastic resonance amplitude vs. variance windows thereby optimally counteracting the downtrends causing uncertainties or noise or fluctuations (recently we proposed such a scheme to the fed utilizing generalized Black-Scholes -like stochastic feedback control)...it is simply periodic driving of the stochastic random and complex system the market is. This periodic driving is steady of sorts and will drive the market in the direction sought upwards if continued indefinitely, by printed monies borrowed against a sought recovery to be trickled into by driving a measure of the economy such as the stock markets to highs, enriching the ~10% of stock investors who actually profit, these 100% the ~1% of U.S. citizenry....Expectations and sentiment do matter however, greatly...and the expectation by the U.S. citizenry that an economic recovery is occuring spurs investment and hiring and housing recovery and so forth. When or does this driving stimuli... effectively equivalent to reducing below zero the prime lending rate, traditionally the fed's control mechanism... cease to function effectively? When its risk reducing effect given the diminishing returns due to cost of borrowing is compared to the real value of the assets equities etc. of the markets, something calculatable generally as the 'risk free rate of returns' traditionally calculated as based on the prime lending rate set by the fed is now additionally the qe quarterly easing rate set again by the fed, this going into a gigantic Black-Scholes like valuation model of the markets and economy with indices acting as asset equities...recent funding for large Manhattan project -like efforts to understand these complex and complicated dynamics have been set aside internationally re "complex systems institutes" tasked for economics and finance by NATO and other unlikely funders...it is expected however that the next meltdown will occur on its delayed schedule of 2013-2014 though it be quenched somewhat, and results from such institutes researches will be taken up following the repetitive damage.
Expect it when you least expect it....the volatility drops to all time lows as (stochasticity plateaus or levels of variances) phase transition (or scales transition, a form of frustrated continuous phase transition similar to glassy physics) from rapid fluctuations to quiescent periods of near determinism, reflected in consensus of bullish behavior dominating. The 'external' forces exposure due to the open system that markets informatics are (meaning uncertainty magnitudes are in reality not diminished, merely temporarily screened against or glossed over and or ignored, a form of irrational exuberance) then occur with magnified effects at peak amplitude-to-variance SR windows, with seemingly innocuous news rippling throughout the system and the system reverses, consensus fragments, the system here markets selling off. This occurs at highs, past highs at the point where even bears are due to continuing bullishness must seek to trade in the market direction, adding their temporarily bullish sentiment to the mix, meaning at the contrarian most bullish point which due to consensus is where most are not expecting it...See our next installment for an excess demand update, that being a phase transition bull bear theoretic model borrowed from glassy physics, magnetism, etc...
Forecast 104: Forecast 11March2012

Oracle $34.71 closing price previous day...the rally continued from earnings season has a momentum, and has resulted in a delaying of the downtrend expected, with a seemingly sideways trading of ORCL following very closely the larger S&P500 market direction. The direction however is downtrending, with some analysts calling a 5% correction into the 2nd quarter earnings. We have mentioned that short term 3-5day trends have been burned out by perturbations of forces of news driven exuberance rally and fed and therefore have gone to medium scale 3day intervals, 5day intervals and 10day intervals long term scales...here graphed we show several proprietary indicators of 1days and 3days intervals, with explanatory comments and inset.
Summary: as short term 3-5days peaks-to-troughs have burned out by forces on the longer scales, and the ORCL stock has fluctuated sideways in a trading range near highs of ~90days cyclicals of ~$35.00, we have been tracking the medium to long term scale cyclicals, as we wish to forecast the timing of the downtrend from ~90days highs. Well, the peak occured with high probability ~10days ago, and the trend is downtrending for 3-5 X10dayintervals and by the medium 5days intervals P&Ts and Pindicators...
Notes: that being said, larger market forces are expected to push the limit of this 'wake' effect of the market rally, and we expect possibly one to two false second peaks before the sharper (if second peaks occur) sell off... of a so called correction pr actually a cyclical large scale oscillation a result of ~90days quarterly earnings periodic driving and uncertainty randomness driving forces acting together to form a slow large scale a) SR stochastic resonance (similar to the third kind, between the periodic and aperiodic types) like system effect. See LTRs longer term risk for more details on this effect and scroll down to forecasts ~80-100 for more discussions of these effects. We remind you of our discussion of other driving periodic forces, of b) options expiry end of month which drives stocks prices towards expected expiry prices (see cited papers), of c) fed monthly QE a current driving perturbation intended to counteract downtrend pull and uncertainty which has resulted in uptrending markets and the current rally to highs, d) seasonal winter summer interest re demand and risk appetite the sell in may and go away effect which resulted this previous year in a >150% disparity in gains between the winter trading season and the summer season e) the 4year election cycle and political and policy turnover effect which has coincided with 4-6 year LTR long term risk events of economic crashes resembling economic meltdowns, at least the last 3-4 cycles, with previous lower magnitude crashes having also occured per cyclical and one expected barring effectiveness of fed QE this trading year and forecasted this upcoming spring summer low volume low gains season.
Forecast 103: 25February2013 Long Term Risk forecasts

Oracle prices close $34.23 25Feb2013... we shifted our forecasts as with the news driven market to longer term risk LTRs as the shorter term trending cycles of 6-10days completely were perturbed out into fast 1day to 2day fluctuations but within the longer term cycles of 30-50days of trough-to-peak and as a cycle is back to troughs double these numbers and you get the ~90days cycles we all have been looking at recently in the markets...for reasoning behind these cales and what forms a cycle read our recent forecasts from ~80-100 and the LTRs risk left menu...
Anyways, the S&P500 has broken its all time highs and quickly trended down again... for ORCL, the peak that was coincidentally formed was a high of ~90days cycles... expectations supported by moving averages and probabilistic proprietary indicators are that the trend is downtrending to a bottom or trough to be reached in 15-25days or so barring more news driven perturbations and intervention by the fed to 'bolster prices', a move that may temporarily drive prices upwards but would (as it is not an optimal dynamic stochastic feedback control but merely a steady state like approach of semi continuous monthly periodic 'shocks') in the longer term yet not manage to prevent the correction effects that go hand in hand with the cycles..So! if you folks out there really want to quench corrections and crashes, suggest to your local fed to invest in some inexpensive "stochastic feedback control" software and have them 'shock' the system monetarily ( by infusing money and or QE and or prime lending rate manipulation and so forth) by computationally optimized perturbations and as when monetary easing and interest rates setting would have optimal effect as calculated with mathematical precision NOW AVAILABLE! The question then would be how free would the resulting free market be? However folks, there is a world of difference between preventing a crash that wipes out 50% of all economic wealth and merely manipulating a market for gain.
Summary: ORCL at peak of ~90days cycles presumably, and trend is expected dowtrending barring perturbations and or interventions to the upside and which would have their own set of delaying risk .
FORECAST 103: 25February2013...long term risk forecasts
Oracle closing $34.23 prices ... the STCs short term cycles have been shifted out of 6-10days trough-to-peak-to-trough to fluctuations of 1-2days with no trend or reason a 'sideways' market as it called...however the longer term risk is yet a cyclical trending dynamic and we show the moving averages and the proprietary probabilistic indicators we utilize.
Summary, peak was formed on 30-50days trends or cyclicals (recently thus the ~90 days cycles) a week or so ago, and current expectation is downtrending towards a trough to be formed in ~10-25days
Summary, peak was formed on 30-50days trends or cyclicals (recently thus the ~90 days cycles) a week or so ago, and current expectation is downtrending towards a trough to be formed in ~10-25days
Forecast 102: 11February2012...are STCs resuming?

Oracle prices $34.90 the prices scaled for visualization and the P&T's peaks&troughs indicator scaled with probability of occurence of consecutive trend days (blue&red)...the expectation is that an uptrend will commence for 3-5intervals.
The quarterly earnings recently with bullish driving keeping prices of ORCL and other tech sector stocks near highs, meaning the regular rhythm of 3-5days-to-3-5days peaks-to-troughs-to-peaks was 'shifted' out of rhythm or into ~20-40days rhythms...please read our recent longer term analytics for forecasts and graphs of the statistics...we then reported the longer term statistics in recent previous forecasts that included even the high levels of prices by news driven 'forces' as just another fluctuation though on the longer scales.
Summary: long term forecast is for a downtrend or a correction or pullback take your pick that is to commence as early as tomorrow but within 1-2intervals of 5days/interval and to also last for 3-5intervals and with magnitudes of ~4%-7%...within this is shorter term 1days/intervals fluctuations of which we are seeing potentially the resumption of and of 3-5days trough to peak and of magnitudes of ~2%-3%. As we confirm the shorter term cyclicals resuming we will report more detailed technicals or statistical graphs of the direction and magnitude and timing.
Forecast 101: 07Febryary2013
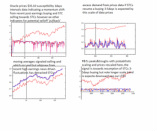
Oracle prices $35.10 ..the several indicators are showing the earnings season artificially heightened levels of price and demand as news driven speculation drives prices higher...
This is invariably followed by investor selloffs either as profit taking or as disatisfaction...this 'psychology' of the market, the chartist tracking of this is graphed and shown (see LTRs menu left) in our previous forecasts also the cyclical quarterly ups and downs effects of this artificial perturbing effect see forecasts76-80, previous earnings season ~90days ago and recently also ...you will note the sell offs that follow such highs.
The normal cyclicals if unperturbed are cyclical 5day cycles that is weekly cycles///then are options expiry cycles monthly, then quarterly earnings 3month cycles then yearly cycles then 4year or thereabouts 'political' cycles of elections and with such of policy and economics and these not surprisngly coincide with the STCs short term cyclicals of 3-5days peaks to troughs, the quarterly cyclicals pf ~90days peaks and troughs then the 4-6 years economic meltdowns we have been discussing in our LTRs long term risk menu left.
Therefore we are expecting post earnings resumption of STCs inside the MTCs medium scale fluctuations inside the LTRs long term fluctuations..it is a very mechanistic 'system' when mathematics a.k.a.'technicals' of randomness and fluctuatioons are considered, and very human when interactions between investors that produce the technicals are considered. The post earnings STCs are graphed left and we will present more of our proprietary indicators in the next few days if STCs do resume.
Summary: The trend by MTCs is downwards expectations of a 'pullback' or correction signaled by several indicators see previous forecasts and other methods extra Pittnachioff.com such as investor intelligence.com and other proven indicators... the STCs are however signaling a post earnings opportunity buying ...that is the STCs 1days intervals are signaling a buy opportunity at a trough of ORCL following 3-5days of selling.
Again we caution that at MTCs medium scale risk is signaling a 'pullback' or correction of ~4%-7% and as MTCs are 5days/interval next 3-5intervals once STCs are resumed and confirmed post earnings artificial perturbs.
Long term risk cyclicals are yet signaling impending or imminent (on decadal years scales 1- 6months is imminent!) meltdown...however note that 'this time' there is a counter pertubance that of the fed in the form of a non-sophisticated (meaning it is not a synchronized counter fluctuation to the negating fluctuations..that of mathematics of stochastic feedback control see our papers and references therein) but is a near constant driving force that of QEconstant quarterly easing...Will it work? to quench the 4-6years downwards crashes and meltdowns? Yes if brute force is applied consistently as the system will follow the driving (upwards) force exerted by the fed AND if the force is of sufficient strength to counteract the strongest fluctuations and (stochastic resonance) its amplification with the periodicity downwards...not an elegant solution but a solution.
Forecast 99: 29January2013
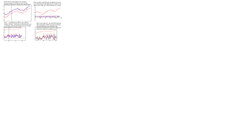
Oracle prices $35.34 ...we have due to earnings season shifted to weekly forecasts of ~5days intervals (ticks) as the STCs short term cyclicals of 1days intervals that last about 3-5days of troughstopeaks and similarly of 3-5days of peakstotroughs have been 'perturbed' to the longer scale cyclicals ...meaning that earnings artificially keep prices fluctuating near the uptrend or downtrend depending on how the overall big picture big economics news of the market forces drive the trend, and currently they have been uptrending due to active involvement by fed QE and the large numbers of upbeat economic reports.
The cyclicals then are approximately self-similar at medium time scales of 5days intervals with 3-5 'intervals' of trough to peak and 3-5 'intervals' of peak to trough with the current '4weeks' of uptrending representing a near peak that is expected to sell off in the next interval or two. A profitable trade then is to leverage the expected ~4%-8% medium scale fluctuations into large profits by utilizing options of calls+puts called straddles see http://www.cboe.com for risks disclosures. Note that a ~4%-8% change in price translates to ~50%-100% ROI yet after the cost of the position is achieved at ~2%-3% on the expected way down , with potentially a similar profit on the 'return leg' as the prices then fluctuate trending back upwards. Currently we are heavily positioned on puts expecting the downtrend selloff following our very profitable uptrend portion of the trade that occured in the past several weeks.
Another profitable trade in the similar method is to trade earnings momentum...the earnings reports usually promote a few stocks with a 'beating estimates' or the 'underperforming' type...the trade is to place straddles on a few in each direction, the expected 4%-9% changes that begin showing or occuring in a few seconds after the opening bell showing which are the investor favorites, selling the none movers and retaining the bubbling ones, following this by end of day selling of the gaining sides of the positions with bubble anticlimactic deflation then regaining the other sides of the trades.... this often produces 20%-40% ROI in a few minutes with further 10%-20% in days to weeks...NOTE the straddle is by definition a zero risk (minus transactions costs) trade that profits by 'large' movement' of the stock optioned here 'large' ~3%-4% or greater. Summary: options leverage great gains...they lose great monies if unprotected thus a zero risk straddle of put+call is the trade advised...the profitability comes after the stock moves sufficient amounts of ~3% or more ...how to trade this? by a service such as ours that quantifies such movements forecasting their timing with sufficiently accurate timing, and or by known event driven movers such as earnings season and so forth.
Happy tradings.
Forecast 98: 14January2013
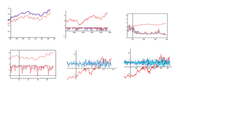
Oracle closing $34.98 14Janu2013... the signals by indicators were to sell as of today which did commence.. however though today selling to $34.60 occured by closing quarterly earnings enthusiasm the latest news driven shifter (the previous recent shifter the fiscal cliff) of out of STCs short term cyclical peaks to troughs into MTCs medium term cyclicals peaks to troughs had the prices rise to slightly higher than the previous day's close. This actually allowed the satisfaction of trade placement for both directions in actuality...
However the continued buying and it seems to be diminshing should in 1-3 days become a selling and proportionately to how long STCs were violated, meaning an MTCs level of 4%-7% of 3-5intervals (see previous recent forecasts for continuity and details) and we set MTCs at 4-6days/interval. This is supported by sell signals that occured a few days ago were the three scales we track coincided as sell signals.
Then with sell signals generated what is the upside risk...news driven shifts 'a rally' that then are tracked by longer term cyclicals than we are featuring here, and that occur on scale of years by the way, and although they do have a small yet significant probability of occuring as do large crashes.
Forecast 97: 08January2013
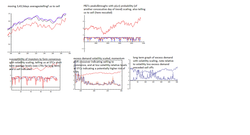
Oracle prices data closing ~$34.63 ... we had an editing technical difficulty recently where our graphs were not uploaded or rendered properly ...however as recent news driven perturbations of the STCs short term cyclicals caused shifts out of the regular dynamics of 1day tick intervals to longer periods for tracking useful trends we have moved to a near weekly forecast of MTCs medium term cyclicals ...see the P(X,T) indicator of qRMT random matrix theory nonextensive statistics for more indicators next graphs...
Summary: Recent peak was predicted accurately and selling occured as forecasted...occured for ~3days buying prematurely began but in keeping with quarterly earnings perturbations of news driven faux rallies. This will fluctuate in and out of STCs to MTCs (short to medium scale and then back) for the next week or two, so we are after recent fiscal fluctuations still in another STCs mode...Therefore we are providing weekly free forecasts or longer but with the full covered range of time scales by our several proprietary indicators.
Summary: cycles of STCs short term within cycles of MTCs medium term within LTRs cycles long term ...look for the coincided peaks of all three scales ~friday last which we showed occuring, to occur as forecasted with short term cyclicals fluctuating out of 3-5days trough to peak timing but within the more stable medium scale fluctuations of 3-5'INTERVALS' of ~5days/interval trough to or
peak...For LTRs long term cyclicals see our LTRS pages left menu and our regular forecasts keeping track of the multi year cyclicals. Note: if we were to recommend a trade given the current fluctuations it would not be at STCs short term scales utilizing stocks directly...we would recommend instead to wait for the next STCs or MTCs trough, buying a straddle of zero risk at which point in a few weeks the ~5%-8% uptrend leg by 100% in value of the call option increasing would have paid for all of the straddle, leaving all of the downwards leg of the put option which would be near zero 0% of value to recover its value making further riskless profit...timing recommended is to sit it out until the next confirmed bottom which will occur in 2-4'intervals' of ~5days/interval keep tuned in.
Forecast 97 : 08January2013
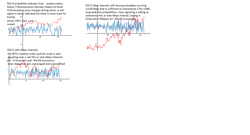
Oracle closing $34.63 07Jan2013 ...we're at STC highs with sell signals (see additional indicators next graphs) by P(X,T) random matrix 1days intervals as by other indicators excess demand etc...
The longer term forecasts are interestingly also signaling selling at MTC medium term and LTRs long term risk time scales...with STCs ranging from 3-5days peak to trough and multiscale multipliers of 3-5intervals (say of 4daysXinterval and 9daysXintervals ) the forecast is of STCs fluctuating as the longer term cyclicals also trend down and forecasted as trending downwards at each time scale inside its longer time scale ofcourse .
What about news driven rallies? they may occur, and be touted as rallies, but statistical dynamics is telling us that the self-similar ups and downs at different time scales are at a peak right now for the three time scales of dailies weeklies and monthlies tick intervals (approximated by 10days intervals as they occur approximately at 2/1007 days ...). Therefore be wary of earnings faux rallies, and watch for the downtrend...
Reminder, check other indicators we recommend put/call ratios at http://www.CBOE.com and points&figures at
http://www.investorintelligence.com
Otherwise subscribe to tradersentiment.com as traders tend to trade their sentiment irregardless of economics and it is a reasonably accurate predictor... ...
For LTRs long term risk see our menu left and previous forecasts 76-80 as to possibility of 4-5year LPOs log periodic oscillations, cyclicals economic meltdowns as measured by of ~50% of total economy as measured by S&P500 say...currently the precursors of a meltdown are beginning to take shape...the LPOs as discussed in our LTRs menu left pages are 'obvious' as 'counting down' to some event and as previous cyclicals coincinding with the 'count down' have been meltdowns we assume the 'count' is for yet another polarization of sentiment that will lead to a crash re meltdown with very complex and random systems stuff such as frustrated 'glassy like' phase transitions the theories describing such... the other 'noticed' precursor of low volatility sinking to all time lows as it has recently to lower than the all time lows of 2008 when the two indications of extremely low volatility indicating consensus of bullishness occured just as the markets reached all time highs...the high consensus left the markets vulnerable to fragmentation as a reversion to the mean of averaged risk preference, and as with more detail the at resonance of amplitude to noise ratio meant that the most innocuous of news or information was sufficient to begin a cascading chain reaction that led to the fragmentation of consensus and a reversion to the means of risk preference.
THINGS ARE DIFFERENT HOWEVER ...preventative measures however are in place that did not exist in 2008... shock absorber but as the fed and teams of PhDs do not seem to have heard of stochastic resonance and phase transitions but only recently have feds put money into complex random systems R&D to measure and forecast LTRs, a steady state version of counter-perturbations or stabilizing-cushions to the uptrend and lowered volatility and impending expected and or feared meltdosn crash of 5-7years cyclicals of LTRs...a steady state long position called QE4,3,2,1 that did not exist in 2008-2009 50% meltdown or 2001-2002 50% meltdown and previously of ~1997 of ~30% and before and on and so on for though lesser amounts. The other factor is that the market is not as overpriced intrinsically as it was during previous cyclicals which knowledge of a speculation in stock markets atmosphere was known by most traders and added to the withdrawal or panic. However the overall economic numbers have gotten worse in terms of debt...in terms of needed balances of budget and cutbacks in spending and this other speculative 'bubble' of debt is however very well known by traders and is another source of speculation that may exacerbate pullbacks withdrawals panics and selloffs especially if the price of the debt and its long term impact is actually priced in and not just priced in at the speculative level with offsets by QE. So we can conclude that a) the situation is vulnerable to a meltdown b) this is known by feds worldwide c) efforts massively are underway to counteract the potential of the cyclical timing of the next meltdown d) no one in policy making has a real understanding of the causes of the 5-7 year meltdowns, evidence is no one took steps to counteract the 2007-2008 meltdown and crash e) why the cyclical occurs why it became recently much more exacerbated in magnitude (from 10% in the 1970s to 50% in the 2007-2009) f) no one in policy is 'officially' listening to the tens of thousands of PhDs Wall Street hired which it can safely be said a small percentage of which know the frustrated phase transitions and stochastic resonance theories which have in some part been applied to economy and published widely..unoficially however it should be mentioned that large amounts of monies have recently been granted to research just these theories of interacting traders in markets in several nations now 'worried' about recurring meltdowns. It will probably yield a systematic agreed upon dogma after this crisis passes in a year or two...in the meantime we suggest very strongly you keep a sharp eye out for compacency and rallies consensus of bullishness and low volatility of the consensus forming crowd as it is precisely when the most vulnerable conditions in markets occur. We mentioned recently very simple strategies that can save an investment... trade the downward legs of the ups and downs as you now have access to very accurate market timing not just from us but from the indicators we have recommended and the trade in the direction of any sudden meltings..trade riskless straddles of puts+calls on MTCs medium scale timing which can offset trading costs and obtain easily riskless 40%-70% returns on 5%-9% movement of an investment in a few weeks to a few months per trade...you then only need a few such trades per year and you are outperforming the strongest performing funds...we reiterate that this can be performed at zero risk. Otherwise become the underwriter of such straddles and realize the '90% of all options expire worthless' keeping 90% of all premiums paid to you, you have the published research (by other writers elsewhere) indicating monthlies option expiry prices pinning research to make you feel safer...also consider getting out of stocks markets altogether for the next year until the meltdown materializes or it is shown that the steady state QE perturbation has quenched it. Other assets need to be traded by somebody...do you hear about Forex currencies much? NO and because of the old adage that where there is hidden smoke someone doesn't want to advertise the profits they are making. What about coffee and oranges juice? And what about becoming an angel investor providing venture capital for a percentage of a technology or service you believe in. How about opening a fund or an investment bank or , yopu can charter one at state or federal level with
Forecast 96: 02January2013
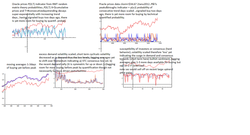
Oracle prices $34.69 closing. The graphs of proprietary indicators are showcased.. graph1 is the P(X,T) probabilistic indicator with recent buying signaled both by peak instantaneous and crossover of lagging average indicating momentum shift here longer time scale probabilities, graph2 P&Ts peaks&troughs indicator (blue&red) + p(x,t) probability of occurence of yet another consecutive buying or selling trend day, graph3 is moving averages and graphs4,5 are excess demand and susceptibility respectively these measuring market investors interaction dynamics that emerge value and therefore prices .
The indicators all signaled the recent bottom and buying opportunity accurately, and are yet showing that there is more room for buying before the peak is reached and sell signal is indicated expect 1-3 days of more buying but we expect (to be confirmed by levels tomorrow) selling to increase by friday and to close dowside by monday.
The recent buying was after a mini rally and yet has the potential to correct proportionately , it has been driven higher and faster more recently by news driving perturbations as 'fiscal cliff'' news were responded to by 'relieved' investors who 'rallied' on the 'deal reached'...the realities are somewhat different however...long term bolstering of markets by questioned policy of QE (increasing amount of currency in the markets to pay for the easing has consequences debated) to counterbalance fear real as it is of effects of unsustainable large debt, with legislative expiration of previous administration's tax policy a managed news opportunity...the news buildup having a slight yet significant (a few % today for example) albeit short time effect (in buildup <2% was cliff, 6-8% was risk appetite return of investors from summer and end of year opportunities and upvaluation from QE, and ~3.5% was news bump today) ...long term and fundamentals and technicals chartists and quantitative analysts re 'investors', market makers and investors, indicated their positions by the other means of insuring their risk and investing in the future position...recently they utilizing ORCL as exemplar stock drove prices to $33.00 by late December options expiry again 'pinning' the price, and indicated 2:1 $34.00 as a reachable price by mid January though with room for large uncertainties with spread to $31.00 due to preknowledge of the resulting impact of news driving of the political legislative type causing a fluctuation...cautious as usual however with good cause. Add to this correction anticipated from recent minirally of MTCs medium term scales, and the caution about debt and economic realities. We add in the knowledge by many 'insiders' ..that is, professional investors and market analysts.. of LONG term risk of economic meltdown or 'crash' of VLP very large proportions (acronym?) for a total of CBOE traded put/call options expiry that is two peaked 2:1 near $34.00calls and $31.00puts with for example normally one peak expiry such as last month's $33.00 peak. This divergence is not a usual occurence and harbors with its uncertainty by investors actual large scale effects.
Summary: indicators STCs short term buying can continue for 1-3 more days at reduced %
Summary: MTCs will be posted next few days and LTRs are yet as posted see left menu and LTRs forecasts scroll down for several near forecast73,76,...
Forecast 95: 28December2012 Weekend
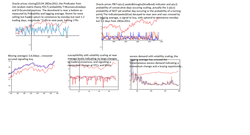
Oracle prices $33.04 closing...The recent downtrend from the minirally is forecasted as coming to a bottom interim, and a buying opportunity by dynamics is signaled...read out recent forecasts for LTRs long term risk discussion.
Summary: an interim bottom reached an uptrend buying to coomence 1-2days (monday or later) for 3-5days by STCs.
Summary: ,a downtrend by MTCs of 20days is expected as a correction to the fast recent minirally at the 5daysXintervals scales...this is however not as clearly priced in so to speak as the options expiry which 19th January is spread 2:1 in favor of Calls:$34,$33, to Puts:$31,$30 supposedly indicating a $32.00 target price but that is not the case...the price is forecasted nearer $33 by 'weight' of written issue. And we remind you of published work showing that market makers tend to drive price towards majority options expiry. However 'close enough' in optionsepiry is also a factor, so we expect to see the ~$32.00 prices visited at least once. To reiterate the recent minirally has a downside that is yet to be fully developed...it is more than likely that news drivel politics of economics will time to further extend the rally, however then followed within the time scales discussed by a downturn.
Summary: LTRs long term risk is yet a factor...real fiscal issues of debt are yet to be solved and planned out, these will provide a news driving of consensus, shorter term rallying then flagging on long term realities. These effects are easily noted as to occur, they are merely investor psychology and are the 'driving forces of investor psychology' which receive press with technical charting graphing indicators receiving much less press and it seems to this analyst are much less known and or practiceably (utilized) understood. Also completely not understood (we mean here scientifically) are dynamics on LONG long term risk scales. The 4-5years cyclical crashes that have occured in ~2008 for 50% losses, in ~2002 for 50% losses, in ~1997 for 25% losses, they loom ahead...it might even be considered that QE quarterly easing and other measures are to quench the cyclical effect and hopefully to eliminate it entirely. We mention the LTRs graphs of menu left LTRs pages and which we have been tracking for several months see for example also near forecasts63,71,75...these tell us that an LPOs like pattern of periodic oscillations are decreasing towards a critical point, which region of criticality (it is actually smeared out into a +/- range) we have currently entered, and as the transition is from near highs and cyclical 4-5years patterns there is a higher likelihood of a downturn rather than an upswing. We then advise to trade cautiously utilizing insurance instruments of options of calls and puts (of long straddles, and if writing the insurance of butterflies and condors) and if with equities to insure the risk side of any trade of equities, or else trade with the risk direction, shorting the equities at STC and MTC peaks as you have access to timing.
Note: While it is true that at STCs levels of ~2% per cyclical a straddle is not quite as profitable as one would want, regular 20% profits per trade are obtainable with timing and discount brokering. MTCs tend to fluctuate 4%-7% and this is certainly profitable for the patient investor with a good timer of markets..we do not recommend this, but a straddle on a 6% upswing or downturn obtains a ~50% return
Forecast 94: 27December2012-
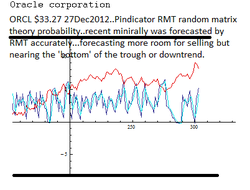
Oracle corporation prices $33.27 27Dec2012...we are also pleased with ourselves this season The actual reason is that out analytics are astonishing even ourselves (with more to come)...we forecasted this recent minirally a few weeks ago and thus far it has been very profitable, and hopefully for you as well as we continue to showcase our capabilities with the free weekly or more frequent forecasts and depending on the time scale of the dynamics the market has shifted into...
Summary: the P(X,T) or "Pindicator" has the recent downturn which began 4trading days ago continuing for 1-3days, the bottom being reached when the lagging (light blue) crosses over with the instantaneous P(X,T) random matrix theory Wigner distribution of nonextensive statistics...note and we are selling analytical capability here...note the accuracy of the predictive power of this indicator derived as it is from the precisely accurate statistics of complex random systems a category of which stock markets certainly belong to..please see our capabilities pages for more details and also forecasts 76-80...Note the leading nature of the indicator as it is P(X,T) the probability of occurence of X=$cumulative prices in a trending move and T=#consecutive days of the trending move , and the 1-P(X,T) the probability of NOT yet another consecutive day OR the probability precisely calculated of a trend reversal, a market directionality change, and the P(X,T) of prices occuring yet as the precisely calculated timing of the probability of a direction change 'reversal' occurs
Summary: selling to continue 2-4 days to ~$32.00 barring political theater as applied to economics and the resulting 'news driven' market counter movement...expect the bottom to occur as soon as tomorrow but next week next 1-3days...
Note: remember to hedge against LTRs...LONG long term risk, not just the news driven fluctuations that shift dynamics from STCs short term cyclicals of peaks to troughs of 5-7days to MTCs medium Term cyclicals as we have now of ~20-30days peak to troughs, but the LONG long term cyclicals see menu left LTRs pages...note closely the 'countdown' to 'something'...that something is from physics an LPOs Log Periodic Oscillations precursor to a transition in scales...its what happens when the individual directions of bias of millions of individual 'opinions' (spins etc.) coalesce or fragment (excess demand theory and or nonextensive statistics based frustrated phase transitions theory)...in the case of markets if it is not prevented it will be a 'rally' with most investors having become bullish, a statistical outlier numbers of consecutive days of a rally (nonextensive random matrix theory), volatility hitting all time lows (LPOs and phase transitions), as healthy wariness and uncertainty (dynamic equilibrium ) gives way to deluded bullish (or bearish) consensus (reducing volatility), the large scale trend following (herd behavior, consensus of opinion formation as we call it and or susceptibility from phase transitions theory)...causing the markets to become vulnerable to the slightest shock or innocuous bit of news (SR stochastic resonance theory ) which then is very quickly followed by the fragmenting of the consensus or scattering of the herd, a correction (on STCs to MTCs scales) or a crash or meltdown on the MTCs to LTRs cyclicals time scales...We mention 'cyclicals' due to an observed fact, the markets have cycles up to and including the recurring economic crashes or meltdowns of ~4-6years cycles...the MTCs of ~3-5months, the STCs of ~1-2weeks, and though days and hours and down to seconds also have organizational structure, we only provide 1day intervals data analytics on our free forecasts. Well, you know the warning signs, hedge accordingly...we remind you of a very simple hedge during times such as these, and if you do not wish to utilize options puts calls insurance...only trade the downtrends..if a crash 'Black Someday' hits, you are already in the direction of the trade...otherwise on MTCs at peaks or troughs signals a straddle trade almost always generates large profitability, and on STCs careful use by experience can overcome the large exchange fees that reduce profitability on the time scale of movement and the magnitude of movement that must occur to emerge profit. Also for the savvy(?) investor the known selling or writing of options with analytics can generate large profits also as "90% of all options expire worthless" quoted, and we remind you that it has been shown that market makers tend to 'pin' the equity price at the majority options expiry price.
Good luck with your tradings and season's greetings.
Forecast 93: 20December2012
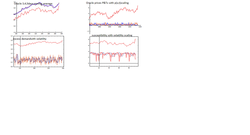
Oracle prices closing ~$31.92 ...the past week to two have been out of STCs short term cyclicals range of peaks-to-troughs, as we reported...as such we went to medium term cyclicals graphs,. reporting every few days forecasts.
As our first set of data graphs and forecasts, we show the regular dayticks data and moving averages, P&Ts peakstroughs graph2, excess demand graph3 and investor consensus re susceptibility graph4...
Summary: instantaneous 1daytick indicators are out of their scale, however lagging indicators of their moving averages are tracking the medium term cyclicals 'MTCs'...expect the recent uptrend minirally which was forecasted weeks ago by us (see forecasts 89,90 for most recent MTCs) by several proprietary methods (excess demand, RMT random matrix theory, inverse volatility...) and compared with existing methods of moving averages, put/call ratios (cboe.com), points&figures (investorintelligence.com), options expiry (ameritrade.com)...well, it is near its peak see graphs and next set of graph forecasts. Simply stated by options expiry arguments: nearly 70000 calls options ORCL were at $33.00 for 22Dec, and the 19January2013 has a spread of ~20000puts at $31, ~30000puts at $32.00 and twice that amount for the other side of the spread of $33calls and $34calls respectively. The interpretation is that the 'smart money(??)' saw the minirally coming, which now is developing into an uncertainty as to direction of by-the-19thJanuary2012 prices direction with ~2:1 call.put ratio BUT A RANGE (CONTRARY TO A SPREAD)! meaning the consensus (and traders investors market makers tend to trade their consensus irregardless of realities of economics, for the most part...), the consensus is a range around $33.00 but with uncertainty (large) about both direction and by numbers of investors.
Having mentioned markets consensus, what will play out is a drop as the recent mini rally follows its MTCs (see forecasts cited and the medium term cyclicals of peaks to troughs) to a peak, followed by 2-4intervals of (~5days/interval) of selling, but then attempting to break upwards...however during this news driven LTRs scale events will come into play, both to attempt to drive the markets upwards by fed market makers and investor risk appetite, and the down risk of the by now 'forgotten' LONG LTRs 4-5year economic meltdown! and we again remind you...it has been published elsewhere by SR stochastic resonance by LPOs log periodic oscillations etc. and by us by excess demand theory and random matri that it is when a rally mentality sets in and consensus forms (say ~2:1) that volatility drops to 'all time' relative lows and a crash follows from the rally.
Forecast 92 : 07December2012 weekend
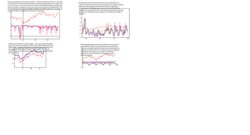
Oracle prices closing $31.92 the recent overdemand has yet to correct in strength proportional to its uptrend and price changes...aside from its initial selling wednesday of ~2% at lows but then closing at ~1.3% from the peak. We discuss the dynamics in the previous several forecasts . Here we are tracking the selling dynamics, whether they will continue as the STCs, as an LTRs minicorrection (for lack of a better word) or if the minirally will uptrend again which though unlikely yet has a significant probability of doing. See forecast for P*(X,T) random matrix indicator a probability quantifier of trends and prices on multi time scales. The longer time sales are disussed in the past few days of forecasts as we tracked the minirally especially forecast 90 which shows the LTR cycles and durations of trends of longer peaks to troughs. .
Forecast 91 : 05December2012-06December2012
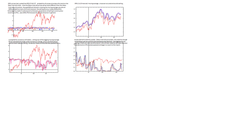
Oracle prices EOD or closing $31.96 ...the 5days intervals p5(x,t)probability weighted p&Ts peaks&troughs indicator graph1 signaled a sell on this scale, and we reported for several days now that the 1days intervals indicator p1(x,t) had signaled selling as of several days ago yet buying continued to overdemand by STCs short term time scales' cyclicals. The markets multi-scale self-similarity we quantified in forecasts 78,80 and LTRs and capabilities left menu...
Other graphs are moving averages graph2 indicated selling on 1day intervals yet at 5day intervals are somewhat whipsawing unless the roll over is taken into account see insets of graphs for more explanations. The remaining graphs are susceptibility and excess demand quantifiers of overbought and oversold market dynamics which also had been indicating the selling that commenced today, though we refer you to LTRs left menu and our recent forecasts 89 for long LTRs term risk market directionality.
Summary: selling was signaled and occured with reasonable strength proportional to the overdemand on STC scales, today dipping to ~2% at lows but closing ~1.3%. It is expected selling will continue even as an STC of 2-4days intra the LTRs trend...i)overdemand has to revert to the mean ii) a one day selloff interspersing the minirally implies an effective continuation of the buying and by statistics even at 2days intervals occurence of 6intervals is an overdemand iii) the 5days intervals peaks&troughs signaled selling on the medium time scale (order of magnitude longer approx. ) and it also has the self-similar cyclical nature with trending 'intervals of 2-4 as opposed to trending days. Markets quantified at ocurence of outliers of ~2/1107days (see LTRs datagraphs) of 9consecutive days rarely breakout in steep rallies, and nearly half the time (of 8,7,6days )such steep minirallies actually have preceeded corrections and their larger versions slow crash dynamics, a precursor to which has been low volatility, low put/call ratios, consensus bullish formed market wide, and the emergence or occurence of outliers.
Forecast 90: 04December2012-05December2012
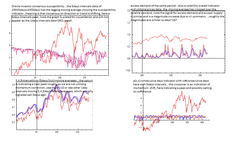
Oracle $32.38 (red,scaled) 5days intervals ticks graphs of susceptibility consensus graph1, excess demand graph2, traditional moving averages graph3, p(x,t) #consecutive trend days probability withP&Ts peaks&troughs graph4...see insets for explanations.
The indicators are summarized as being dynamically out of the 1days intervals scale, the dynamics of longer term scales of medium LTRs being more appropriate to give information of direction and magnitude...as ~10consecutive days is ~2/1100days occurence the order of magnitude is expected to give us information about longer term dynamics of which we are characterizing the recent ~10days buying upturn as an overdemand as considered by STCs short term cyclical peaks-to-troughs 1days dynamics...
Summary: the indicators are indicating momentum shift, meaning this current or next (1-2intervals) (remember here they are x5days/interval) there is expected selling to commence that should resemble midscale excess demand selling. Intra these LTR dynamics is expected to resume STCs 1day p&T dynamics.
Forecast 90 : 04December2012-05December2012
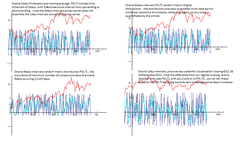
Oracle prices P(X,T) random matrices nonextensive statistics Wigner distribution "Pindicator" (marketing chose this trademark...). The 1days to 9days intervals or STCs to LONG LTRs scales are graphed, and as the multi-scale (subtly different yet intimately related with multi-fractals) complex random systems that markets are... are precisely quantified by the RMT random matrix theory nonextensive ensembles' Wigner distribution on any scale!
Summary: 1days STCs decayed to <0.5% several days ago indicating selling was to commence...on longer time scales which the STCs being violated and meaning a sale transition to longer term time scale dynamics was occuring, the 3days , 6days and 9days RMT and averages are indicating that the upturn minirally is about to selloff. For LONG long term risk directionality and timing, see further our recent LTRs menu left or Forecast89.
Summary: 1days STCs decayed to <0.5% several days ago indicating selling was to commence...on longer time scales which the STCs being violated and meaning a sale transition to longer term time scale dynamics was occuring, the 3days , 6days and 9days RMT and averages are indicating that the upturn minirally is about to selloff. For LONG long term risk directionality and timing, see further our recent LTRs menu left or Forecast89.
Forecast 89: 03Dec2012-04Dec2012
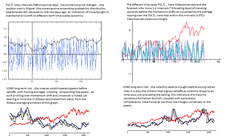
Oracle prices long term months (medium scales) and LONG term scales of years dynamics and statistics...see graphs insets for explanations and forecasts78,80.
Summary: the current minirally overdemand buying is within the LTRs scales a dynamial event, with its own cyclical (peaks-to-trough-to-peak) dynamics that we quantify here...
Summary: the buying expected to continue uptrending for 10-20days but with shorter term sell-offs at shorter cyclical scales of STCs of 3-5days troughs-to-peaks...magnitudes can simply be estimated visually from graphs.
Note: we can apply our theories and proprietary indicators to the long LTRs as our apriori nonlinear statistics were developed to describe multi-fractals chaos and complex and random systems that span scales ranging across several orders of magnitudes such as seconds days and years ...and we show these elsewhere, however we feel traders and investors are more familiar with concepts of volatility as indiators at long term time scales and we wish to connect our approaches to the current prevalent knowledge.
Forecast 89: 30November-03De
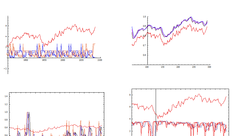
Oracle $32.17 the buying continuing seemingly without concern for economic realities and risk...see previous forecasts for explanations of graphs...
The first graph1 is peaks&troughs with p(x,t) probability of occurence of consecutive trend days ...the number of uptrend days 9consecutive occuring for example at ~2/1107 days , of 3consecutive days ~316/1107 days, of 2consecutive days ~512/1107 (see forecast 80), it is no wonder that P&Tp(x,t) decayed to near <1% probability two trading days ago...meaning trend reversal or selling by technicals was expected at ~95% probability two days ago...sell signals were also indicated by traditional moving averages graph2...
So what the markets is driving this minirally and overdemand (graphs3,4)...by short term scales dynamics the market is overbought and was expected to correct as of last thursday...
Long term risk LTRs may provide an answer...see our next forecasts and menu to the left.
Summary: short term dynamics tell us the market is in overbought overdemand, with a short term cyclicals sell-off to occur proportionately.
Forecast 88: 29November2012-30November2012
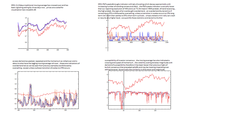
Oracle $31.85 prices are scaled for visualization...t eindicators are compared wit traditional movin averaes..note all are sginaling clearly selling...so what is happening?
Overdemand and its consequences are selloffs as reversion to the mean occurs despite the most fervent desires for rallies and or crashes (by dynamics)
There is another dynamic however ...the markets have several correlations scales, and we simplify these to days' STCs short term and LTRs long term risk of medium months and long years.... a cyclical of months resembles corrections every 90days or so but there is a converse to this dynamically on the same scales that of a mini rally....we recently predicted one to occur in 10day intervals to commence within 10day interval , however as the STCs scales it will have its own elongated peaks to troughs that last 3-5 10daysintervals. We will be watchinh this overdemand at STCs dynamics scales to seee if transitions into a leg of an LTRs uptrend to a peak see our LTRs menu left .
Forecast 87: 28November2012-29November2012
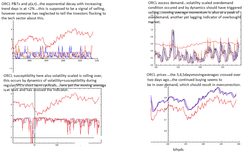
Oracle prices $31.80 the continued selling is past STC dynamics, and is a mini rally for lack of a better term, as opposite of a selloff correction...two choices, refer to our medium scale forecasts, which although we discuss and quantify as dynamics at the edge of STCs our focus, we do not regulary publish...though medium scale 10dayintervals or thereabouts do not need be published daily or weekly...
Summary: in mini rally outside of STCs expected 1-2 10dayintervals, but as the shorter scale cyclicals it can i) shift down to STCs ii) it can be interspersed by selling iii) it can be the abbreviated peak of confidence preceding the Long long term slowcrash predicted at the edge of medium LTRs long term risk if so expect a) volatility to sink to all time lows b) put/call ratios to decline to <1 c) investor trader sentiment to peak on bullishness d) there is a +/-months on this model's time scale..
Summary: in mini rally outside of STCs expected 1-2 10dayintervals, but as the shorter scale cyclicals it can i) shift down to STCs ii) it can be interspersed by selling iii) it can be the abbreviated peak of confidence preceding the Long long term slowcrash predicted at the edge of medium LTRs long term risk if so expect a) volatility to sink to all time lows b) put/call ratios to decline to <1 c) investor trader sentiment to peak on bullishness d) there is a +/-months on this model's time scale..
Forecast 87: 27November2012-28November2012
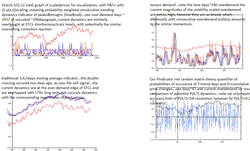
Oracle prices$31.22 scaled graphs of proprietary indicators...the P&Ts graph1 with probabilities of trending days has been indicating selling, as have the moving averages indicator and Pindicator the rmt random matrix theory indicator. See graph insets for discussions and recent forecasts.
Summary: selling is expected as an overdemand has continued to develop, and its backlash is expected to have a magnitude proportional to the overdemand magnitude. That is potentially 2-3 ~3% STCs-like 'legs' of selling interspersed with shallow buying.
Note: there is on the longer term cyclicals' risk quantification scales a forecast showing 10dayintervals data bottom formation see LTRs menu on the left...that implies an uptrend mini rally to commence next 1-3 10daysinterval, or a short bottom respite that then is followed by additional downtrend which then is classified as a sell-off...LONG long term cyclicals say the latter with a slow crash predicted (see LTRs graphs and dicussions menu left) however with +/-4months margin of error and that coupled with additional lead/lag uncertainties of the onset of LPOs log periodic oscillations. Note our previous discussions about quenching slow crashes, or the effort by the feds central banks etc. to tranform a slow crash into a series of quenched steps...this coupled with market makers' and traders investors risk aversion is oped will accomplish the quenching.
Forecast 86: 26November2012 to 27November2012

Oracle closing price$30.96, graphs scaled for visualization price data series and Pindicator the probability P(X,T) from rmt random matrix theory that T=#consecutive trend days will occur, with X=$cumulative price changes...the distribution decays to zero P(X,T)->0% with increasing trend days and or increasing price cumulative changes...this indicating 1-P->100% of trend reversal in this case sell sginaled.
So what is happenig as the sell signal was given nominally two trading days ago friday and more so yesterday monday? over-demand overbuying, shifting the dynamics from STCs short term cyclicals to medium scale LTRs long term risk cyclicals...there are three directions
i) an STCs over-demand overreaction or correction selloff today tuesday 27Nov2012,
ii) a continued buying as a mini rally predicted as potentially in the making by medium LTRs begins this 10days interval (but which was expected to begin after this next peak to trough selling (which was signaled yesterday) by regular STCs short term cyclicals dynamics.
iii) a sell-off dynamics of the LONG LTRs type as the medium and STCs short term selling and medium scale coalesce into a sell-off.
Summary: the peaks-to-troughs occur even during selloffs! they are shifted however from their expected averages towards abbreviated trends or interspersed by more fluctuations mid-trends...this means there will be a selling following this over-demand , whether it occurs now abbreviated or after yet another surge of buying, see our volatility scaled excess demand indicator for more on this. And see our medium andn LONG LTRs for more long term forecasts.
Note: we limit our expectation of resolution of our Pindicator to 95% and 5% as most events of trend reversal occur within this window, and outside of which is overlapping with medium LTRs and as a subset of LONG term...that is at P(x,t)<5% lthe dynamics are characterized as being shifted out of STCs short term cyclicals and are within the dynamics of longer time scales risk.
Forecast 85: 26November2012 to 27November2012
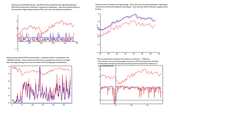
Oracle prices$30.96..the P&T peaks&troughs (1-p(x,t)) weighted here p(x,t) just the exponential decaying rate of occurence of consecutive trend days (e.x. 9updays occur 2/1107days, 2updays 364/1107days etc..see previous forecast78 ) decayed to <5% less-than-reported-resolution yesterday...the current buying continuing as an overdemand, which by STCs shirt term cyclical dynamics rebounds and tends to become overcorrected, with the caveat that a shift away from STCs at the edges of overdemand to LTRs dynamics (somewhat like a rubber band tearing) has a small but significant probability of occuring.
The second graph is the traditional 3,4,5days moving averages and it i) rolled over ii) crossed over by both lagging averages...these signals of selling and as of yesterday.
The third graph is excess demand scaled with volatility...not as apparent as the midgraph overdemand and its correction which occured ~110days ago and which had the similar numbers of consecutive buying days and cumulative prices, yet had a lower than average volatility which hit lows and remained at lows for several days...that a sign of majority consensus, in that case of bullishness as the majority of traders investors felt the market was to continue uptrending...that is not sustainable obviously. an overdemand n this instance is not simultaneously occuring with a lowered volatility that has then remained at lows...that means a sizeable fraction of traders investors are not convinced of the directionality, actually a healthy caution and reaction towrds the reality of risk, and one that may quench the correction to the overdemand.
The fourth graph is the susceptibility, or the consensus of traders investors...the number of days is differently scaled but here the overdemand last cyclical is near the first quarter of the graph...the magnitudes of the volatility scaled consensus can be visually estimated (for quantification contact our admin staff) and the current overdemand consensus is not anywhere near the magnitudes seen last cyclical (see our LTRs left menu for a zoom out of the cyclicals LTRs ).
This means that i) the reaction of selling magnitude or correction will be quenched on the STCs scales, and ii) there may be a medium scale trend reversal as the selling expected occurs 'shallowly' and resulting in the potential mini rally on the 10dayintervals scale as the bottom rolls over to commence see LTRs pages.
Forecast 84: 23November2012 & Week-End to 26November2012
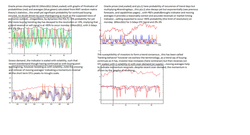
Oracle prices close=$30.92 ...the recent buying trend continued despite the signals by several indicators to sell...for example see forecast83 the Pindicator was at 93% of a reversal, the excess demand and susceptibility were at highs and moving averages had crossings of momentum reversal indicating a sell signal!
So what happened? the small yet significant probability of further trending or buying in this case happened...these are called outliers statistically. The number of days of a trend and average of price changes cluster near small average values excepting for a few large events...this is what makes a squeezed Bell-Shaped curve statistics, sharper near the small values but also with fat or long tails for outliers...at any scale from these STCs short term cycles to seconds, hours, days, months and years, this being called 'multi-scale' or from nonlinear and chaos 'multi-fractal'.
Or Thanks Giving happened, a physical day-to-day type of event that occurs once a year, with a market closing holiday ...and with accompanying exuberance, holiday feelings, etc...and by the news headlines "A brighter world economic outlook" happened...this from the past few days when the same outlook was "concerns over ....". There are realities here as well...tax legislations a.k.a. fiscal cliffs, the national debt, and those geopolitical events that perturb.
Summary: P(X,T)<5% the limit of the resolution, indicating >95% of reversal or selling...the other indicator merely are..."more so..." or indicating higher momentum reversals and cross-overs depths and so forth...
Expect 3-5days of selling by STCs dynamics and 2%-3% magnitude...unless i) the market suddenly rallies (possible with news driving ) ii) the market not suddenly 'corrects' (possible as LTRs are indicating this over 4-5years cycles and with +/-months.
Note: We recently provided the medium scale LTRs..these are indicating a bottom forming on the recent LTRs and a potential for a mini rally to occur for 30-50days next 10daysinterval...i) with +/- margins of uncertainty this may also perturb the next downtrend ii) yet also medium LTRs have their own cyclicals violating non-dynamics...the forecasted mini-rally may be turned into a sell-off if the LONG LTRs dynamics of 4-5yearscyclicals occur earlier in their margin of error...We mention these small yet significant timescales-dependent risks during this appropo moment of thanksgiving and its exuberant over-buying...
Forecast 83: 21November2012-23November2012
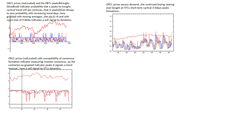
Oracle prices closing~$30.40 the graphs of P&Ts peaks&troughs probability indicator and excess demand and susceptibility of investor opinion are showcased...
There yet existed a small yet signifcant probability by dynamics for more buying today (~13%) and buying continued but mixed with an early upsurge followed by a decline to thhe opening levels by midday followed by a gradual uptrend to the close... this despite several indicators signaling selling, meaning demand bullish sentiment was yet strong and drove the market upwards following the technical traders' selling
Summary: The P&T indicator graph1 is indicating p(x,t)->7% and its moving average momentum is rolling over and has crossed over...several more signals to sell are the highs near overdemand levels of the excess demand indicator, and the highs of susceptibility investors trend-following aversion...
Summary: sell signal is generated, to commence 23Nov2012 most likely (but with i) yet signif. probab. of more buying by dynamics ii) a potential mini rally violating the STCs dynamics if after news driven events re 'fiscal cliff' hurrahs)..the selling expected to downtrend for 3-5days ~2%3% (these are the current averages by dynamics..what are you going to do!!! if you require higher volatilities or longer or shorter STCs cyclical peak-to-troughs, contact our sales staff we can recommend markets and structure analytics for your investment needs).
Forecast 83: 21November-23November2012

Oracle prices closing~$30.40 ...two indicators signaling selling...the first graph is Pindicator (we didn't come up with any better marketing names for it..) utilizing cutting edge statistics&probability RMT random matrix theory and the celebrated Wigner Statistics derived from nonextensive statistical ensembles...meaning: highly accurate statistics of financial markets ..see capabilities page for more details and papers referenced. The second graph is the 3,4,5days moving average which has made the 'double cross' (some other marketing expert came up with that decades ago...) indicating a sell signal.
Summary: rmt P(X,T)->7%, meaning ~93% probability of trend reversal or selling for 3-5days for ~2%-3% peak-to-trough to commence next trading day 23Nov2012 by dynamics and we remind you that non-dynamics news driven events are possible both a mini rally by legislative fiscal cliff resolution and sell-off by LTRs long term risk debt concerns and so forth.
Summary: rmt P(X,T)->7%, meaning ~93% probability of trend reversal or selling for 3-5days for ~2%-3% peak-to-trough to commence next trading day 23Nov2012 by dynamics and we remind you that non-dynamics news driven events are possible both a mini rally by legislative fiscal cliff resolution and sell-off by LTRs long term risk debt concerns and so forth.
Forecast 82: 20November2012-21November2012
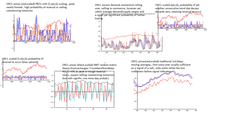
Oracle $30.20 (red,scaled) ...graphs of P&Ts peaks&troughs graph1 scaled with probability of another-trending-day, which decays exponentially p(x,t) ...if price changes are added as in RMT random matrices distributions P(X,T) (capitalized for distinguishment..see forecast 80) statistics from which we derive the proprietary Pindicator graph5, then the decay day to day is super-exponentially (nomenclature from super-Gaussian statistics a.k.a. power-law statistics)...Moving averages indicator graph6 also a useful signal...see insets for explanatory comments and discussions.
Summary: a peak of short-term-cycles has formed and a sell signal is indicated...selling should commence tomorrow 21Nov2012 for 3-5days of ~2%3% magnitude..
Note: this forecast and summary is by dynamics and statistics as graphed for ease of visualization and quantified statistically...there is i) significant probability of yet 1-2days of shallow buying ii) possibility of news driven events (the fiscal cliff 'resolution' legislative for example would presumably have an irrationally exuberant temporary mini rally...) perturbing the STC short term trends cyclicals of trough-to-peaks-to-troughs......and with news driven perturbations themselves visible as statistics and dynamics effects on much longer time scales LTRs which we discuss at length elsewhere (see menu to the left and previous forecasts LTRs ).
Forecast 81: 19November2012-20November2012
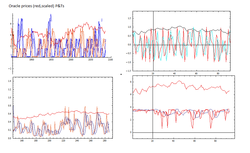
Oracle prices data graphed scaled for visualization closing=$30.14
The P&Ts graph1 (blue&red) peaks&trous indicator tat utilizes consecutive days of a trend statistics (see previous forecasts and capabilities pages for more..) is indicating more room for buying this STCs trough to peak cyclical.,..expect 1-2days buying but with significant probability of trend reversal as soon as tomorrow...trade recommended is short or puts as peak is confirmed for the expected ~3% downtrend and its put multiplier.
P(X,T) probability indicator graph2...similarly indivcating room for more buying but quicly approaching P(X,T)->0 of another trending trading consecutive day
The excess demand measures oversold and overbought conditions, graphs3 and susceptibility to trend formation of consensus by traders which is derived from excess demand graph4...current levels near averages (no elevated STC violating selloff or rally) and averages momentum indicating i) room for buying 1-2days.
Forecast 80 : 16November2012

Oracle prices data series closing=$30.00 ..the random matrix distribution is graphed with moving averages...room for more buying this STC short term cycle if trend continued 1-3days peak ~2%-3% from trough...
Forecast 80 : 16November2012
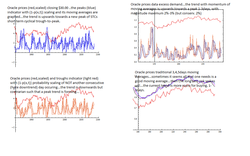
Oracle prices data... P&Ts peaks&troughs graphs1,3 and excess demand graph2 with traditional moving averages graph4...see the insets to the graphs for explanations.
summary: the peak is yet to be formed this STC eaning ~1-3days and ~%2 ... this seen by probability scaled P&Ts trends and excess demand moving average momentum which is yet to uptrend...the traditional moving averages show this as the indicator rolls over towards its next cross-over or peak sell signal.
summary: the peak is yet to be formed this STC eaning ~1-3days and ~%2 ... this seen by probability scaled P&Ts trends and excess demand moving average momentum which is yet to uptrend...the traditional moving averages show this as the indicator rolls over towards its next cross-over or peak sell signal.
Forecast 78: 15November2012
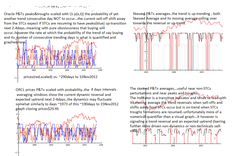
Oracle closing=$29.95 15Nov2012...graphs of proprietary indicators...see insets for explanations.
Summary: The recent sell-off appears to be over..this by momentum of excess demand and susceptibility of investor consensus a.k.a trending..., expect uptrending short term cyclicals STCs of trough to peak having resumed and for 2-4days with ~3% magnitude trough-to-peak...
this may i) be interspersed with fluctuations of selling ii) may be derailed by sell-off dynamics, which may be 'shifted into' by the discussed (and see follow up graphs) STCs dynamics violating news driven events...
note: news driven events on the days STCs short time scales appears on LTRs long term risk scales a.k.a. also known as 'longer time scales' statistics and dynamics' as merely dynamics and statistical fluctuations...as what is fluctuations on the days time scales is merely statistical dynamics on the months and years time scales! We have regularly featured these longer time scales cycles LTRs and risk utilizing our discussed-at-length multi-scale capable nonextensive and RMT random matrix theory statistics..note the RMTnonextensive statistics were originally co-authored by us to describe accurately Chaos, multi-fractals, and complex and random systems...we recently innovated another first by introducing the theory to quantitative economics and finance...Yay!
Forecast 78: 15November2012
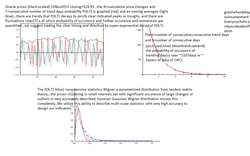
Oracle prices' P(X,T) RMT random matrix theory P-indicator probabilistic indicator (hey...if you have a better marketable name for this email us!) ...see insets for explanatory comments.
We have been suggesting consistently that if you are a non-institutional and non-highfrequency-daytrader (contact our sales staff for high frequency and automation if you are..) , that you trade the ~10trades/100days whose probability of success exceeds ninety percent >90%...these are here graphed as the super-exponentially decaying (here more angled as the time-ticks are days not hours minutes or seconds...) P-indicator trends towards zero% or where the probability of yet another uptrend or downtrend day approaches zero%. P(X,T)->0%.. ofcourse this means that the converse or 1-P(X,T)->100% the probability of a trend reversal nears 100%!!!!...this is precisely the market timing that professional traders seek, the mythical (however many other not-quite-as-excellent methods exist ...) "market timing is crucial to success in investing in the markets" ...
Summary: reversal occured, uptrend expected to occur 2-4days ~3% this estimation by our other indicators...also be prepared for potential fluctuations or selling days mid-STC uptrending...also as we are recovering from sell-off conditions, risk yet exists of back-sliding as does news driven sell-off perturbances. Check market direction before trading.
Forecast 78 : 15November2012
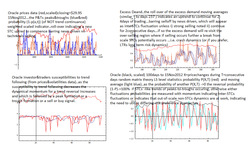
Oracle prices data closing=$29.95 graphs of proprietary indicators...see inset for comments and discussions...
Summary: by momentum and by several indicators at differing scales (and see the preceding days' forecasts) , the recent selling is expected to abate and uptrend to commence infact continue 2-4days ~!3%
Summary: by momentum and by several indicators at differing scales (and see the preceding days' forecasts) , the recent selling is expected to abate and uptrend to commence infact continue 2-4days ~!3%
Forecast 76: 14November2012
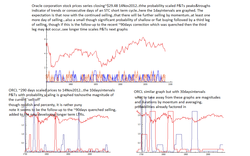
Oracle prices data series 14Nov2012 scaled for ease of visualization closing~$29.48
The selling continued...no longer an STC sort term cycles dynamical peaks-to-troughs, but confirmed as discussed as a sell-off.
The sell-off or correction...what are its statistics, dynamics...utilizing 1dayintervals in graph1 over hundreds of trading days ending 14Nov2012 we see there is room for more selling, and this will be noted by other daysintervals indicators...utilizing P&Ts peaks&troughs scaled with probability p(x,t) of consecutive trend days of 10dayintervals graph2 the magnitude by dynamics of this recent sell-off is quantified...note visually its magnitude is not severe but comparable in the >600days trading days (by 10day intervals) to days ~20 or a third of the way into the graph2. The third graph3 is 30daysintervals and the current sell-off is yet again seen to be a correction mid-magnitude.
In fact there recently was a sell-off condition that occured and which we tracked and discussed at ength..therein we noted that as in past ~90day cycles preceding te past two, there were selling corrections that occured in several 'spurts' ...that is rater than a ~10% sell-off occuring in rapid three leg succession as of the most recent ~90days cycle correction, the ~10% sell-off occured in two or more sell-offs of ~4% that were interspersed by resumed regular STC short term cyclical dynamics...this recent selling fits the dynamics as it was not preceeded by over-demand (see last forecast excess demand graphs) and therefore did not over-correct rapidly, but was preceeded by a decrease in demand or a reduced excess demand that then corrected to a slight over-demand, a sell-off that was quenched, and then regular STCs resumed which now are re-perturbed to a continued sell-off...these possibilities were discussed in forecasts ~48-54.
Summary: room for more selling as sell-off verified...however if the sell-off follows past dynamics and the statistics then it is nearing its end...a total of ~5%-8% is expected then for this recent sell-off, to be further sold off for ~1-3days...if the sell-off is then followed by non-STCs flat or shallow or even excessively high buying then a third sell-off is possible at ~90day cyclical time scales in one to two STCs. These may coincide with news driven events including legislative time tables.
Other concerns are a) news driven sell-off or crash b) LTRs longer term risk of large magnitude slow-crash , with several indications of such an event having been set into motion see LTRs previous forecasts and our dedicated page (left menu).
c) We suggest that you read our recent forecasts discussing probabilistic indicators of the medium 10dayintervals and the forecast for an uptrend to occur for 30-50days or 3intervals-5intervals if i) the sell-off is quenched ii) if the LTR is also queched or delayed , and by the same mechanisms that quenched the small scale sell-off recently...of fed and QE and risk preferences of large market makers and individual traders. And we mention again that often quenching a crash merely delays and or transforms crashes into steps, meaning that most crashes including the recent historical 4-5year cycles slow-crashes (which for example melted 50% of the value of the S&P500) occur after a.majority has agreed that market hindrances have been removed and a mini rally develops. Therefore expect the fiscal cliff to be solved in some fashion, to be passed up, for debt troubles to be considered being handled by QE4 or similar mechanisms and with a rally that has volatility trending to all time lows as put/call ratios drop to all time lows...see our historical quantified graphs of this. If this occurs, there will be a slow crash, and the trading strategy preferred in such a case are long term puts...say 3months or 6months.
Summary: For STCs traders...We are sidelining our trading until STCs resume as we are focusing on STCs trading as proof-of method and as preference...other longer term trades e.x. purchasing puts ~20days ago were possible but we chose not to...we then are awaiting what we have termed as high probability of successful profit making trades...they occur by STCs ~10/100days...the best trade signals being the peak signals that preceed 3-5days of selling, where yet a correction or news event were to occur in the current non-bull sentiment, the trade would merely be more profitable...timing and magnitude prediction and forecasts during STCs as we have been showing you are a very accurately quantified set of events...for STCs...for STCs.... Therefore one merely waits (in info lingo) for the next STC peak, it should occur barring crash following the STCs resumption and then 3-5days following...we trade (and we do not recommend this..) naked puts, purchased the day before the peak occurs before the markets close...timing and magnitude and duration quantified, the residual risk is of a sudden rally occuring..these occur with a small yet significant probability, and therefore one keeps closely yet relaxedly near one's money... typical returns on a 3-day ~3% change by puts is ~60% after costs fees and cautious observation. This more than makes up for higher frequency ups and downs trading with losses and gains not quite amounting to the relaxed trades...aside from not satisying the so called risk appetite.
Forecast 75: 13November2012
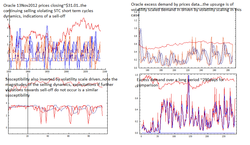
Oracle prices scaled for visualization close~$31.01 13Nov2012...graphs are of peaks&troughs currently nearing highs for selling, but a news driven sell-off would indicate as such at this stage, only after several days of off-STCs or short term cycles perturbation would a confirmation of a sell-off be made..
Summary: the STC short term cycle is expected to trend upwards %2%-3% 2-4 days by dynamics of STCs ..
Caution: significant probability of STCs violation and continued sell-off...caution...advise that sideline until STCs confirmed as resumed if not trading LTR large risk sell-off potential...
Note: any violation of this by non-dynamics (at this scale) is a sell-off condition if continued off-cyclicals or off-STCs..if selling continues tomorrow strongly, then expect this to be a sell-off leg, if it be confirmed by yet another selling day (3days).
Note: is there a way this selling coulld have been predicted...if continued a sell-off...The graphs of excess demand and susceptibility measure and quantify this risk...note the lows of the excess demand and highs of the inverted or contrarian susceptibility...near averages is safety with STCs trending their peaks-to-troughs...at the highs or lows are over-demand and under-demand, with breakage of STCs cycles and sell-offs and the occasional rally and as over-corrections to...These breakages appear as perturbations to the STCs and at near peaks&troughs as extended days of selling or buying interspersed with fluctuations and news events that are reported as the causes and which at times actually are...we warn of these and have recently...the other type of clearly visible over-demand such as occured ~100days trading ago we have discussed before, such corrections to be desired as one 'can see them a'comin' a mile away'...this current fluctuations&perturbations (with news events) type of perturbation STCs violations one can only warn of the risk of as and until they occur....note that on long LTR long term risk scales however, such events as POTUS election, the 4-5year economic meltdown or slow-crash, legislative cliffs, ~90days LTRs or quarterlies..these are known risks and their effects are also known...one can then hedge, sideline or trade accordingly..we are currently focusing on STCs short term but with analytics of the LTRs long term.
Forecast 75: 13November2012
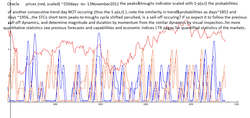
Oracle corp. prices scaled and P&Ts peaks&troughs rescaled with 1-p(x,t)=probability of NOT another consecutive trending day (..that is a probabilistically weighted or scaled indicator of consecutive trend days signaling peak and trough formation..)...current STCs short term cycles violating sell-off has two directions a) resumption of STCs and the forecasted uptrend 2-4days of 2%-3% b) continued selling which if continued for 2days we will consider a sell-off leg. By excess demand (previous graphs) this is rapidly shrinking to a low probability...by probabilistic P&Ts the recent continued selling is a fluc
Forecast 75: 13November2012
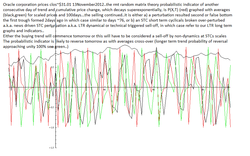
Oracle prices scaled for visualization and the rmt random matrix theory (red) P(X,T) consecutive days and cumulative price change probability...with averages (2timesblack,3timesgreen) ..the current dynamic of the P(X,T) is that an up-trend is to commence tomorrow(or the next day but with higher P(X,T)..)
there are two types of indications here and their averages..the trends which noticeably decay super-exponentially here angling off towards the zero line, and the fluctuations or off-trends that spike up or down , that have a high P(X,T) of not-trending reversals, and that with moving averages are indicated if they will develop into trends or reverse direction.
Current indication is the second type and with averages signaling a reversal, meaning up-trending 2-4days STC.... caveat: barring news events driven sell-off.
Forecast 75: 13November2012
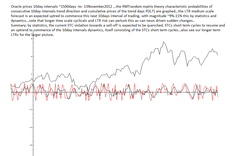
Oracle prices scaled for visualization...the graph is 10day-intervals or of ~10years......-to-13Nov2012...the graph of P(X,T) but of 10day intervals while noting that in ~1107days 9consecutive trending days occured only once...the current indication is that an uptrend is expected to commence next 10day interval of trading lasting 3-5intervals or ~30days-50days with magnitude ~9%-11%...this barring the caveat that a sell-off slow-crash or the 'melt-down' potentially looming by longer term LTRs (see LTRs pages and economy measured by indices..and previous forecasts LTRs discussions) waits that long for a mini rally to occur..this not that far fetched though as large slow-crashes (as their smaller similars) tend to occur with several known factors among them consensus of directionality re rally, a complacent sense of consensus (majority bullish..), volatility decreases to all time lows, put/call ratios decrease to near unity and less...
Forecat 74 : 12November2012
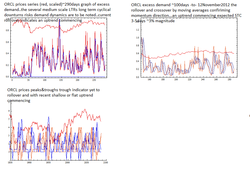
Oracle prices=$31.35...the flat shallow buying as measured by closing prices does not tell the story of highs and lows..however
The current trend is signaled as uptrending, which commenced though flat today...expected to continue 2-4days towardss peak formation magnitude 3%.
Caution: There is a significant probability of a shift from STCs cyclical peaks-to-troughs of the short term to a sell-off condition...this occurs as news driven events becomes dynamics, this occuring with consistent re-occurence of the similar negative or positive effects 'news' events...we have such a case now with several factors coinciding...news driven events, recent medium term trends sidelining investors and their return to a mixed market not conducive to their risk appetite, the fiscal cliff and its news effects, the very real debt crisis, housing market recovery, manipulated production of certain nations, centralized control QE3,4 for example and as interest rates, and centralized control's positive and nagative effects...these events are coinciding with long LTRs long term trends of correction cycles such as ~90days which was hypothetically quenched bu as we discussed shifted or delayed yet with perhaps lessened severity...the long term corrections that are better described as slow crashes or meltdowns occuring 4-5years cycles (recent times) and which are peaking ...now and into 2013. These are known by market makers ( what actually drives the directions of the markets, pins the prices near options expiry, etc..) and market traders, and their risk preference is driving the markets, and it must be stated that their risk tolerance is practically zero, this resulting in very tight fluctuations of indices that when exceeded (say 2% in a 2week period) implies newsworthiness.
There are several quantitative statistical and dynamics predictions that can be made...
a) the market economy as measured by say S&P500 is signaling a large scale transition on the 4-5years scale (see graphs previous forecasts and the pages dedicated to such musings)
b) the largecap stocks that lead indices say Oracle and similar have been indicating a correction on the ~90days trading cycles, a correction that actually has been occuring for the past 15-20 trading days, the news and factors behind the downtrend to be debated as it has been. see graphs previous forecasts and the pages discussing the LTRs.
c) there is by dynamics...by dynamics of statistics and deterministic trends, not by News driven events that become statistics on longer (much) time scales, a medium time scale (of months-to year), there is an increasing probability of a ~7%-10% magnitude up-trend mini-rally to commence next 10-day tradeing cycle and lasting 3-5 intervals (30-50 trading days)...if it is not perturbed prematurely by a crash occuring in mid-LPOs log periodic oscillation, which occurs more often than not in the case of log periodic oscillations, it will occur as has been measured by 10day intervals random matrix theory statistics see LTRs pages and previous forecasts.
Note however that there is evidence, measured quantified and published in peer reviewed journals, that a crash (slow crash ?) occurs at the peak of complacency...volatility measured directly or by VIX volatility index nears all time lows (see graphs LTR pages and forec.) , there is generally an irrational exuberance and everybody buys everything in sight as a clearly rallying trend is agreed upon by most...trader sentiment achieves bullish majority but the contrarian result is what is ahead, other indications are low put/call ratios as reported by CBOE (see graphs LTRs and previous forecasts or CBOE chicago board of exchange). While most analysts will not actually risk their reputations by announcing the hightened risk, there will be hyperbolae with real data and warnings implied, so keep an eye out for these indications...other very goof 'evolved' natural indicators are points&figures, the XOXO lists ...this naturally noticed trend listing was discovered about a century ago, and yet is accurate and useful...it recently predicted the <1390 S&P500 drop while most analysts were yet drivelling about uptrending...did you know that the XOXOs actually are hiding the key to the dnamics of the markets? Stay tuned for our take on this next few months and recall we are theoretical physicists studying interacting traders or n-body problems! Not to worry, most of Wall Street is actually PhDs (the market makers and 'supporting' of the traders desks)these days...
O.K.! so what is left is this flip-flop of bias market-wide (sort of like a magnet "bullish or bearish bias" flipping its (most of) magnetic field in mid buildup...) that we see occuring, the observed result of this frustration of a large crash or rally is LPOs log periodic oscillations occuring fractally observed in prices but more clearly in the volatilities moving averages of prices (see graphs and previous forecasts) and yet which when not quenched havve consistently signaled corrections a.k.a. small crashes...well we want to remind you that on the large scale beyond days scales LTRs and medium months LTRs, there yet lurks the meltdown scales of years' LTRs, and there is a clearly visible LPOs -like countdown occuring...keep an eye on that as the next 'rally' of clearly uptrending events unfolds.
Summary: uptrend next few days 2-4days unless
perturbed by sell-off shifting conditions, which if occuring risk excess over-sellling that results in i) a crash like a spring overstretched breaking ii) a rebound buying mini rally overselling correction however with followup fluctuations to be expected.
Forecast 74: 09Nov2012 Weekend Edition
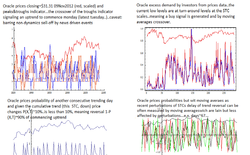
Oracle corporation prices 09November2012 closing price=$31.31.
The graphs of trending peaks&troughs graph1 signaling a near trend reversal and a buy signal..
The graph of excess demand graph2 crossing over indicating a buy.
The probability of another downtrend sell day P(X,T)<10%, conversely a trend reversal 1-P(X,T)>90% by random matrix theory (see capabiities page and previous forecasts).
Summary: indicators agreeing that a trough or bottom is formed and a buying STC sort term cycle about to commence monday but tuesday latest, STCs lasting 3-5days trough-to-peak and ~$3% magnitude.
Caveat: barring sell-off by news driven events, which currently there are several...note: consider during uncertain times, times of fiscal cliffs and economic woes...consider trading the sell signals only...that way not only would you have the STC trend (short term cyclicals down-trend) timed just right, which presumably you would be short selling, trendin the trade profitably on your side, but any news event triggering sell-offs would ony work in your trade's favor.
Note: Did you know...did you know that international markets are correlated and tend to follow and feedback between each other...that is for example at times U.S. indices lead Hong Kong indices, and other times the reverse...this is a half-a-day lead indicator once quantified correctly...contact us for more...
Note: Did you know...did you know that prices have been shown (elsewere) to be 'pinned' near options expiry price for 3month and often 1month options most bought? this is due to market makers trading towards the future price indicated by thousands of bought options contracts...this is a trading signal unto itself
Forcast 73: 08November2012
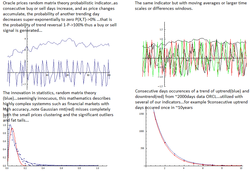
Oracle closing price=$31.43...the random matrix theory (non-extensive statistical ensembles Wigner eigen distribuition) is graphed (blue) and the Gaussian (red) in graph3...the probability indicator derived from the statistics matrices of successive days of a trend and the total uptrend say price changes or downtrend say price changes are graphed in graph1 and with moving averaes graph2...The tallied number of consecutive days of a trend occuring in ~2000days are graphed in graph4..there is a slight but significant asymmetry between down-trending days(red) and up-trending days(blue).
Though the recent POTUS election perturbed the fluctuations out of the STCs short term cycles, trend will resume as it reforms..that is the probability of another consecutive day of a downtrend selling with magnitude of total price change is approaching P(X,T)~5%...meaning the probability of a trend reversal or a buy signal is 1-P(X,T)>90% always a good time dependent probability to trade...caveat: a) there is yet room for more selling, b) barring sudden crash meltdown correction and other news driven and or long term risk time scales events including acts of God and acts of man.
Summary: STCs short term cycles look to resume, 1-P~90% by rmt...a trough is formed or near formation as per your risk preference...check direction before trading, and ofcourse several other indicators...see next graphs!
Forecast 08November2012
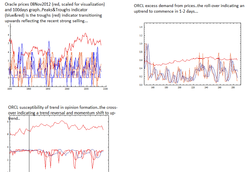
Oracle prices closing price=$31.43...The peaks&troughs indicator continues to transition troughs indicating trough (or bottom) formation of this STC short term cycle, which we loosely consider as a 'strongly perturbed by the recent election' STC peak-to-trough...there is yet room for more selling as can immediately be seen...
The second graph is excess demand , rolling over off of the bottom it indicates resumption of uptrend buying a.k.a. demand....also to be desired as no excesses are wanted and as due to over-corrections to either over-demand (sell-offs ensue..) or over-selling (irratioonal over-buying ensues.., and if sustained, a transition in scales occurs noticed as a crash..).
The third graph is susceptibility...skewed towards measuring up-trend over-demand (too lazy to upload the over-selling graph..)the levels are crossing over indicating also by prices data that an uptrrend is in the making , that a trough is forming or has formed.
Summary: trough forming or has formed, buying to commence tomorrow or next day, for an STC trend of 3-5days to peak...look to confirm this by successive buying days once commencing, and by our indicators excess demand rising to averae and above levels...otherwise if continued strong selling then a potential for sell-off, scale transition (a.k.a. crash).
Forecast 73: 07November2012
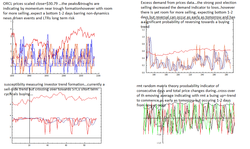
Oracle prices scaled and close=$30.79 ...the graphs of peaks&troughs are indicating with moving averages a trough neared..that is buying trend not justy fluctuation may begin as soon as tomorrow though there is significant probability of further selling..
Summary: though high probability of trend reversal towards a STC short term cycle of 3-5days of buying commencing tomorrow however in 1-2 days latest, there is yet room for selling.
Graphs of demand graphs2 and graphs3 measures of STC risk of over-buying or over-selling indicating near over-sold conditions on the short day to day time scale.
Indicators of demand probability by rmt indicatingwith momentum by moving averages a crossover and a high probability of reversal towards a buying STC 3-5day trend ..the P(X,T)~10% indication of further selling tomorrow, and a 1-P~90% of reversal and buying trend commencing
Forecast 71: 06November2012 LTR long term risk
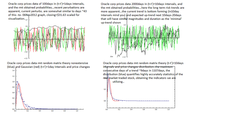
Oracle corpoation as a large capitalization ~$150Billion indicator of the stock market...traded here and there, it follows or actually indices follow it and other 'averaged' large capitalization companies... an indicator then and what we focus on as the 'example' stock, its STCs short term cyclical trends of peaks-to-troughs and its long term risk trends and fluctuations are of importance.
The 1st graph is the 1day intervals probabilities by rmt random matrices and they reflect the recent perturbing effect on STCs cyclical peak-to-trough dynamics...
The second graph is the 10day intervals probabilities by rmt random matrices and the probabilities which indicate on this scale of many weeks to months that we are near a LTR bottom of which there will be an uptrend lasting ~20days-50days 'rally' beginning the next ~10-20days of minimal magnitude comparable to the average at this 10day intervals scale of ~10% by long term statistical dynamics....we again note that that is barring Long-long term risk events on the scale of many months and years, where events similar to 2008-2009 'crash or economic downturn of ~50% of the S&P500 value occured, those discussed in our risks pages and in previous forecasts.
Summary: 1day intervals is indicating selling, however this is perturbed strongly by the election..expect buying days as the trend unfolds...see our other indicators next graphs for more information.
Summary: 10day intervals is indicating buying, with no identifiable scale-sensitive perturbations to interfere with the expected ~20day-50day up-trend with ~10% (averaged maximum) magnitude...however please read our long long term risk analytics and with the caveat that acts of God, acts of man tend to change the best statistical dynamical forecast. Here we quantify this occurence, but that exactly means that there is a small but statistically significant ~5% probability of interference by 'acts'...
Forecast 71: 06November2012
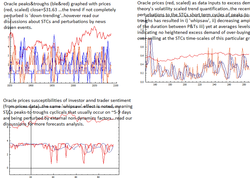
Oracle prices=$31.63 the first graph is peaks&troughs indicating trend is downwards sellling, however this is perturbed by election news driven events, which are causing a mis-timing of demand-supply oscillations yet with their fluctuations...so we have non-traditional pre-election 'mini rallies' which were expected to occur the day after the election, and the recent peak formatiion which then was followed up by selling yet then turned shallow or flat...
Summary: trend is expected down, selling for 1-3days until trough is reached, barring further perturbations which we note may be sufficient to de-track the STCs cycle of peak-to-trough entirely..that is exuberant post election buy-evverything-in-site-itis may be the 'relief' (from what I wonder..., the 'fiscal cliff is yet to be 'fixed', the debt cliff is yet to be 'fixed'...actually that is about it except for:
Note: you can skip this part if you wish ...deep cuts in spending with large increases in education programs and worker citizen training programs reducing unemployment by real significant percentages and an active international export engagement by the U.S. actively developing foreign markets and protecting them from being abandoned as at-home economic perturbations cause investor caution pullbacks...)
Summary: stay by the sidelines next few days...wait for the resumption of the STCs...if you must trade, indications are that selling will resume tomorrow as per trend and by several indicators, however these very indicators are signaling a mid scale reversal of dynamics, meaning that a potential up-trend or stronger than usual buying may begin (actually 'continue') as soon as tomorrow.
Forecast 71: 06November2012

Oracle prices 3,4,5DMA graph1 this traditional 'moving averages' indicator indicating by cross-over as the indicator 'whipsaws' due to perturbing news events that selling is to be expected, if the indicator which at perturbed STCs scales of inter-STCs reversals tends to de-track...
The second graph is the 3day moving average graphed with its moving averages, room for more buying by this indicator, and again for the similar de-tracking reasons of recent inter-STCs reversals in 'trend'.
Summary: stay by the sidelines for the next few days...wait for the right opportunity, there are going to be fluctuations during the short term cycles...until the STCs short term cyclicals resume we suggest staying out.
Forecast 68: 02November2012
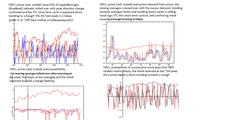
Oracle prices data (red, scaled) and closing=$31.25 ..graph1 is the peaks&troughs showing the trend change to selling and moving averages 3dayswindowed...graph2 the demand from prices data, which has rolled over avoiding over-demand and its resulting sell-offs (on the STCs short term cyclicals time-scales, not the LTRs long term risk time-scales), graph3 is the susceptibility of investors to consensus whether bullish or bearish on STC time-scales and it has also rolled over and nearing averages meaning no immediately worrisome and unrealistic over-demand or over-supply behavior...graph4 is the rmt random matrix theory probability of price&days of consecutive days of a trend occuring (see previous forecasts and capabilities pages for more explanation), measuring probability that another consecutive day of an up-trend or down-trend occurs with probability of price changes, and shown elsewhere the 1-P probability remaining and therefore the probability that a trend reversal will occur, these statistically correlated with peaks&troughs and our other indicators, the statistics describing real markets with astonishing accuracy...
Summary: peak sell signal was followed up on despite mixed early trading..the trend is expected towards a trough to be reached 2-5days with a $2%-3% magnitude...expecting more mixed trading as the POTUS election nears and news driven events perturb the STC short term cyclicals of peak-to-trough.
Summary: peak sell signal was followed up on despite mixed early trading..the trend is expected towards a trough to be reached 2-5days with a $2%-3% magnitude...expecting more mixed trading as the POTUS election nears and news driven events perturb the STC short term cyclicals of peak-to-trough.
Forecast 67: 01November2012
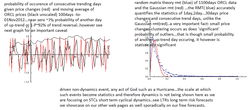
Oracle prices closing =$31.48 ...the probabilities of consecutive trend days which decreases super-exponentially are graphed, as are the rmt random matrix theory distributions or statistics of such price changes in consecutive days here the 4days distributions are shown...note a) the very good mathematical description by the nonextensive random matrix theory (blue) unlike the traditional Gaussian rmt (red) which tends to i) under-estimate the small price changes clustering, ii) decays too rapidly to be able to quantify the statistically siignificant out-liers graph2. See our authored papers 'capabilities' pages and scroll to the references.
The consecutive trend days price-changes probabilities are graphed in graph1 and are indicating that the probability of a STC short term trend reversal or a 'sell signal' is approaching ~90% by statistics and dynamics.
Note: the news driven and event driven effects are not quantified at this level of the statistics and are to be considered external perturbations...the LTRs long term risk analytics however analyzes long term data such that events such as hurricanes and exchanges shut downs become 'merely' another data event on long tern scales of months and years , see our LTRs pages and previous forecasts.
Forecast 67: 01November2012
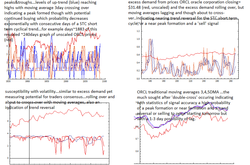
Oracle corporation prices =$31.48 ...the peaks&troughs (blue&red) graph1 is near highs with 3DMA crossing over indicating near-peak formation and a sell signal
The excess demand graph2 indicates trend reversal yet with room for more buying or up-trend, though as discussed the probability decreases super-exponentially with more consecutive days of a trend past the averages...
The susceptibility graph3 a measure of trader and investors consensus also is rolling over with near highs ( inverted) levels...
The traditional 3,4,5DMA moving averages indicator has reached the 'double-cross' an indication of a 'sell signal'.
Note: though indicators are signaling sels or buys, there is a statistically significant chance of indicators being wrong..though not for long...the previous discussion of out-liers is just such a quantification...also note statistically significant occurences of outliers are 'safer' on the up-side, as no sudden rallies of very large magnitude tend to occur with regular frequency and when they do occur one can usually compensate for them or buy the trend, however when sudden crashes occur they have the potential to be more damaging...as such trading the STCs in an environment of economic uncertainty requires specific strategies distinct for up-trends and down-trends.
Note: Human activities tend to 'evolve' methodology from practiced understanding of the particular activity...such a methodology has evolved in the case of stock markets in several approaches.. one very interesting methodology is the one of points&figures or its current distillation as featured on the famous "Investor Intelligence" http://www.investorintelligence.com website...be sure to surf to their website and get a feel for the method...al
Forecast 64: 31October2012
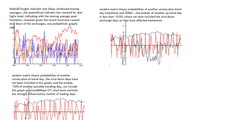
Oracle prtices closing=$30.99...the recent hurricane shut down the exchanges with the SEC's oversight for two business trading days...that leaves the question open as to whether the short term cycles of peaks&troughs (blue&red) should count the two shut down days as trend days at the same prices or as non-trading days, given that expected momentum yet continued...other trend affecting priced impacts the calculated 2%-3% effect on retail the hurricane cost, th to society (see referenced papers and references therein).
Summary: STCs expected to continue peak-to-trough trend with 01Sept2012 by probability indicating ~95% a direction change (with shutdown days as same price days..) and begin trending down...
however if the shutdown days are not included, there is yet a high probability ~30% chance of continued upwards trading...mixed trading signals are currentlly occuring and in no small part due to the shut down of the exchanges and the interruption of the U.S. exchanges trading though international trading, which is mathematically correlated with U.S. trading, continued unabated.
Forecast 64: 31October2012
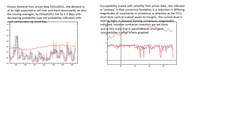
Oracle corporation excess demand graph1 and susceptibility graph2 , from ( graphed rescaled) prices data...the current demand and susceptibility are nearing highs, with momentum rolling over...there is room however for more demand driven buying which may see its rally as searching for reasons to rally seems to be what is happening on the exchanges...to be fair to bulls the quarterly earnings are about average , the stock market ratios of real value to priced value are not entirely over inflated, housing is bouncing back, fed policy is though debated is 'supporting' the markets ... on the concerns side are the fiscal cliffs legislative percentages of taxation and real debt, un-understood 4-5years cycles of economic meltdowns that showed themselves in the past two decades and which are nearing (see LTRs long term risk pages and previous weekly forecasts) .
Forecast 63: 25October2012
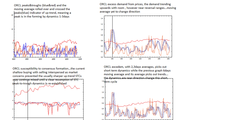
Oracle corporation graphs of prices rescaled closing=$30.85 ...P&Ts peaks&troughs graph1 up-trending towards peak , which may be perturbed by market concerns as strong feedback is occuring between ORCL and indices such as NASDAQ composite and S&P500 , as can be seen during any trading session recently...when that occurs the STC short term dynamics become perturbed as indiex-following to the tune of news driven and economic large scale concerns tend to change the dynamics towards that of random perturbations of the STC short term cycles...the excess demand and susceptibility graphs2,3,4 are measures of over-demand and susceptibility to over-demand as occurs if by dynamics detectable trends towards a majority bullish or bearish opinion occurs, with over-demand followed by sell-offs and over-supply followed by rallies..currently near mean levels as measured at STC short term 3,4,5,6days scales however note that that is not the case at 30days scales, see next forecasts posted with discussions of LTRs long term risk.
Summary: the trend is expected up-wards towards a peak 1-3days with 1%-2% still available by statistics, however strong chance of market concerns perturbing this and causing an early trend reversal towards selling..check market direction before trading or preferraby stay out until STCs resume if you are a peaks-to-troughs trader, or trade longer term trends with insurance by puts&calls.
Summary: the trend is expected up-wards towards a peak 1-3days with 1%-2% still available by statistics, however strong chance of market concerns perturbing this and causing an early trend reversal towards selling..check market direction before trading or preferraby stay out until STCs resume if you are a peaks-to-troughs trader, or trade longer term trends with insurance by puts&calls.
Forecast 63: 25October2012
S&P500 statistics and dynamics graphs of ~2000days prices rescaled for visualization...moving averages are useful for long term charting graph1...the volatility from prices 30,40,50days graph2 is known to trend to a bottom before a correction or down-turn or crash...calls&puts as inputs to excess demand moving averages graph3 similarly have correlation with technical correction dynamics at the long term scale where STC scale news are subsumed into the perturbing dynamical structure...the inverse volatility graph4 clearly shows LPOs log periodic oscillatiomns leading to the corrections and down-turns which fractal are also applicable on differing scales to large draw-downs..
Forecast 63: 25October2012
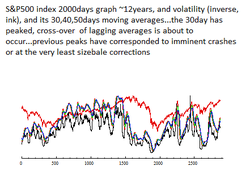
S&P500 ~2000days prices graph rescaled for visualization...volatility is known historically to trend towards a minimum before corrections, after which frantic actvity surges volume..
Here we see clearly visible Log Periodic Oscillations, which though controversial have been proposed as pre-cursors to phase-transition -like changes in organizational dynamics such as occur in stock markets, earthquakes, and other dynaical systems measured by time series with fluctuations.
Here we see clearly visible Log Periodic Oscillations, which though controversial have been proposed as pre-cursors to phase-transition -like changes in organizational dynamics such as occur in stock markets, earthquakes, and other dynaical systems measured by time series with fluctuations.
Forecast 62: 24October2012

Oracle corporation prices closing=$30.65...the graphs of peaks&troughs (blue&red) and excess demand graph2 are to show inter-STCs short term cycles trend continuance and absence of short term over-demand risk....
Summary: though interspersed with selling and market wide concerns, the trend by STCs dynamics is expected upwards towards a peak next 2-4days, barring sell-offs due to corrections and the potential for large scale selling a.k.a. crashes..
Note for more on crashes and large scale long term risk, please see our previous LTR forecasts and we will be compiling our research in a separate web page.
Forecast 61: 23October2012
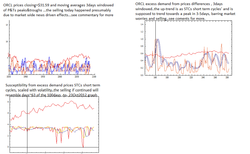
Oracle prices data closing=$31.59 23Oct2012 graphs of peaks&troughs indicator, excess demand from prices, and susceptibility from prices, the graphs of 100days and the prices rescaled for visualization...
The take-away is that though yesterday was a down-tick day,it came after 'strong' pre-market buying of ~0.8% ...there was almost literally no place to trade but down starting at the bell with ~1% selling by the lunch & martinis cocktail hour , given that the major economic indexes were all trending downwards in their STC short term cycles...news mentioned earnings, economic worries, cliffs and large hillocks, foreign countries they've never visited, however you may have noticed there are two types of news stories within the hype, the 'explanatory' and the 'contrarian' to the trend and both were featured to unclarify things.
The big picture is that large debt costs, and is a 'drag on the economy'. News either ignoring this or using this to either 'explain' ups+downs or to drive ups+downs is mostly bunk... investors know this and are hedging their bets,yet as they try to maximize their profits ROI given their individual risk appetites resources and abilities.
Summary: the trend is towards a peak of 2%-4% in 3-5days barring sell-off , with potential selling during the up-trend cycle of trough-to-peak.
Forecast 60: 22October2012
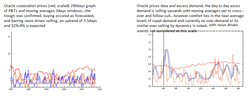
Oracle prices (red, scaled) closing=$30.80 graphs of P&Ts peaks&troughs moving averages proprietary indicators and excess demand prices indicator graph2...
The ORCL stock did buy upwards today as predicted, though after a recent three day 3day selling though strong, the actual post-overdemand dynamics as discussed in previous forecasts. The trend is expected 3-5days upwards towards a peak and of %2-%4 magnitudes, barring news driven perturbations non-dynamic at this STCs scale, and we have discussed the LTRs long term cycles risks and how news driven non-dynamics perturbations become long term dynamics at different timescales elsewhere and in previous forecasts.
The ORCL stock did buy upwards today as predicted, though after a recent three day 3day selling though strong, the actual post-overdemand dynamics as discussed in previous forecasts. The trend is expected 3-5days upwards towards a peak and of %2-%4 magnitudes, barring news driven perturbations non-dynamic at this STCs scale, and we have discussed the LTRs long term cycles risks and how news driven non-dynamics perturbations become long term dynamics at different timescales elsewhere and in previous forecasts.
Forecast LTR long term risk
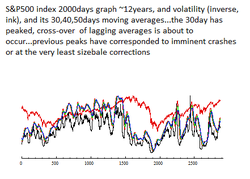
Long term risk ...LTRs the risk in months years etc of downturns of large percentage ex. %50 2008-2009 of the S&P500 value, or crashes of %20 of the DOW in 1987 in a single day.... How do they occur, what are their statistics, what do they graphically look like, how do their dynamics work, what do we know about them...
We will be discussing these with our forecasts, and compiling the LTRs discussed on our long term risk pages.
The short answers...a downturn or slow crash preceeded by corrections (see historical graph ~4-5years ago is "imminent" as early as tomorrow and as late as 2013...we don't mean to be glib, but several intrinsic and extrinsic factors can speed or delay, heighten the effects and or magnitude or quench the same and we discuss these elsewhere in our forecasts... with the caveat that the knowledge of impending 'imminent' things is often sufficient to prevent them, as 'forewarned is fore armed'.
The statistics of this are shown in graph1 ... the volatility before a slowcrash is a down-trending thing, with a minimum reached right before the peak in prices and subsequent crash for example VIX volatility index reached ~15 before the crash of 2008-2009 and recently was near ~24 indicating complacency of consensus formation prior to a reversal to contrary dynamics...put call ratios another indicator also reflect this, with p/c ratio dropping to lows right before large downturns with puts and calls indicators of trader investor sentiment backed by real money and not just opinion....
here the inverse 30days prices data volatility with moving averages rescaled for visualization is graphed, and features of Log Periodic Oscillations are clearly visible, such LPOs controversy aside analogous to precursors to large scale transitions from one phase to another in multi-feature multi-scale or phases systems (think water to ice, water to vapor , 50% up, 50% down...etc..). Here the LPOs can be seen counting down (so to speak) to the crashes also known as corrections when they are ~10%-20% and or slow...
LPOs are fractal or self-similar at differing scales, and though the sharpness of the recent up-trend lost some of the 30days resolution, it shows on other scales, here the previous ~1070 days since the last bottom of the crash of 2008-2009+ are... though themselves on ~90days cycles are themselves LPOs...are on the ~1070days cycle themselves clearly visible on the whole as LPOs -like, with distance between bottoms or troughs decreasing predictably towards a 'singularity' which singular behavior in real data applications is actually coarse grain averaged, and with the effect in prices subsequently pinpointed as the 'peak' though the singular turning point having occured days weeks or even months previously .
Forecast 59: 19October2012
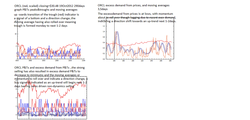
Oracle corporation closing=$30.48 graphs of proprietary moving averages indicators of short term cycles of peak-to-trough-to-peak, and the interacting-traders model of excess demand as obtained from prices graph2 and from the consecutive days P&Ts peaks&troughs indicator graph3. The recent over-demand and resulting strong selling was re-visited in a whip-saw fashion (or an oscillating decay if you prefer..) that though this last STC short term cycle down-trend has only been a three day selling, has been of strong magnitude selling, and therefore has resulted in several indicators signaling a short term bottom and a direction change and therefore a buy signal, monday to next 1-2 days, barring further strong selling due to news driven non-dynamics i.e. fears of economic woes and crashes.
Note: see next few graphs for more details about the statistics of these indicators...
Note: see next few graphs for more details about the statistics of these indicators...
Forecast 59: 19October2012
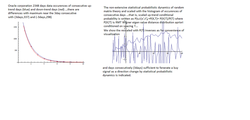
Oracle corporation statistical time dependent dynamics... The graph1 is the consecutive days probability of occurence of up-trending days and down-trending days... nearly equal, there are however differences most markedly near the three consecutive days.
The second graph graph2 is from random matrix theory's Wigner distribution (see presentation of capabilities for more background and our authored papers referenced) ...the probability of sequential days and magnitude of prices decreases towards zero as the number of days of up-trends or downtrends (nearly symmetrical as can be seen simply from graph1) increases...that is even for small increments of price changes, as the number of days inceases the probability of another day of similar dynamics decreases rapidly...and with larger increments, it requires a lesser number of consecutive days. As the near-zero probability of another day of similar up-trend or down-trend is reached, the probability of a direction change, a 'peak' or a 'trough' becomes near 1 one ~100% .
This forms the basis of a statistically correlating indicator...for example, the prediction for monday is that there is a less than ~9% chance of another day of selling, using a conservative approach. This indicator can be combined with moving averages , signaling trend momentum and other features including automation of trading, and can be re-written as the probability of occurence of a direction change 1-P(X,T) as we will be showing next.
Forecast 59: 19October2012
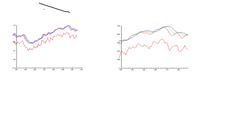
Oracle corporation..moving averages graphs..we utilize the ~$150Billion market capitalization company's market price as a high volume example of our indicators and the traditional indicators...the stock tracks the index closely, is a favorite tech stock and so forth...
The graph1 is the ~100days 19Oct2012 closing =$30.48 ...the 3days of strong selling exceeded even the 'pin the price' options expiry target of $31.00, as strong selling across several composites moved the price lower.
Recent over-demand, a 6days but moderate buying however exceeding average dynamics such as the 3-5days of medium-to-shallow buying or selling, ~2%-4% magnitude of price increases and price decreases...averages calculated from ~1107days of data that have trended up-wards overall for example ~0.52 up-days compared to ~0.48 down-trending days (within error margins and magnitudes also slightly differing accounting for the overall up-trend) , were responded to by strong selling and a 'whip-saw' of the moving averages occured as it does, resulting in the current strong selling over a three day period and the moving averages yet again signaling by the cross-over a buy signal...whether it will be followed up on will be seen monday, as there is investor wariness counter-balancing surges of up-trend buying.
Forecast 58: 18October2012
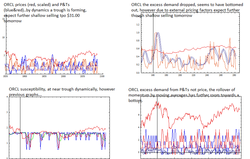
Oracle closing=$31.11 ...the selling strong but petered out towards merely a shallow drop, due to tomorrow's target price of 31.00.
Forecast 58: 18October2012
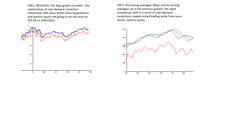
ORCL moving averages...see graphs.
Forecast 56: 16October2012
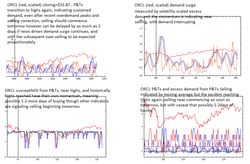
Oracle corporation (red, scaled) closing price=$31.87 the graphs of 1day interval data for P&Ts peaks&troughs and excess demand and susceptibility...the signal is that a peak is near and a sell signal is generated..caveat is that though a small probability of continued buying, it is yet statistically significant see previous data forecasts of random matrix theory and histograms of occurence of buing and selling surges and magnitudes,
Zoom in...click on the graphs, and adjust view from your webbrowser...setting your view to >125% and then clicking on the images seems to work best on IE9 as does re-adjusting view zoom after clicking on the graphs.
Note: occasionally we make mistakes in edit (not necessarily in quantitative analytics)..if you notice one of our occasional slipups please report it to us fnmfnm2@yahoo.com so that we can re-edit and as a service to our other subscribers and followers.
Disclosure: We currently have no positions in ORCL or MSFT
Forecast 56: 17October2012

Oracle prices time series (red, scaled) $31.23 17Oct2012...selling occured after peak, consistent with STCs short term cycles of peak-to-trough ..however the recent overdemand and its correction are yet operating by moving averages or physically by sheer momentum and history-following processes in the markets...meaning though correction sell-off was 'quenched' by strong buying, and seemingly STCs-like peak formation and then selling yesterday an apparent resumtion of short term cycles dynamics driven processes, the over-demand over-correction momentum is still there as is a developing and worrisome unrealistic bullishness that is driven by immediate impact news the kind that leads to complacency of bullishness that preceeds corrections, and unless the selling by STCs like occurs steadily for 2-4 more days and for a further ~1%-3% drop, followed by an up-trend STC , we are yet whipsawing to the over-demand...with earnings, risk-appetite going into the quarter, a seeming need to rally as news driven 'exuberance' is utilized as propelant rather than fundamentals, expect the STCs not to be as predictably timed, as furthermore whipsaws actually de-track indicators leading to mixed trading...do add to this risk of LTRs long term risk of corrections and crashes currently noted by news as concerns over fiscal cliffs and debt.
Summary: uncertainty in direction as STC expected selling will come into perturbation by false expectations from market news driven processes. This to be tested next day to three by STC processes adherence (rational individual risk minimization and profit maximization that contribute to supply-demand dynamics driven markets), that is whether STCs selling continues towards a trough formation or whether it repeatedly is fluctuated.
Summary: uncertainty in direction as STC expected selling will come into perturbation by false expectations from market news driven processes. This to be tested next day to three by STC processes adherence (rational individual risk minimization and profit maximization that contribute to supply-demand dynamics driven markets), that is whether STCs selling continues towards a trough formation or whether it repeatedly is fluctuated.
Forecast 56: 17October2012
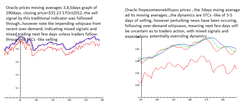
ORCL moving averages ...yesterday a sell signal was indicated and was followed up upon..the next few days will be whipsaw effect days, meaning possible mixed signals. If today further selling occurs, it will strengthen the STC trough formation trend, irregardless of fluctuations, if not then the peak-to-trough trend will have to be re-confirmed subsequent to the down-trend selling towards a trough being re-established.
Note: it is possible that earnings and summits and news driven rallies and a need or appetite for risk not commensurate with economic current facts will override near short term rational dynamics...however there are fundamental limitations a to any irrationally exuberant false rally, with over-demand a signature and over-correction the rational response...however protecting the short term (puts, covered positions..) is necessary and do check market direction before trading.
Note: it is possible that earnings and summits and news driven rallies and a need or appetite for risk not commensurate with economic current facts will override near short term rational dynamics...however there are fundamental limitations a to any irrationally exuberant false rally, with over-demand a signature and over-correction the rational response...however protecting the short term (puts, covered positions..) is necessary and do check market direction before trading.
Forecast54: 15October2012
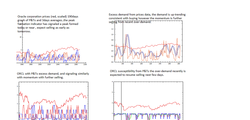
Oracle corporation prices (red, scaled) P&Ts peaks&troughs indicator graph1 with moving averages , the peaks(blue) indicator transitioned upwards into a peak-forming probable range with moving average roll-over and crossing indicating peak and a sell signal as early as tomorrow but next 1-2 days (barring another over-demand)....the excess demand from prices graph2 is indicating this continued demand following the interrupted over-demand correction but the moving average has rolled over indicating the longer STC momentum trend is towards selling and also indicating a peak formation next 1-2days, with the same caveat of barring another over-demand forming.
The graph 3 is of excess demand from P&Ts data not prices and indicates similarly range is near peak formation, with momentum rolling over towards selling or a peak being formed, and graph4 is susceptibility P&Ts , range is near a peak being formed also.
Note: There is room for more buying, beyond the 4th consecutive day tomorrow, however recent over-demand and momentum of correction indicates a selling before STCs resume...check market direction before trading because when dynamics are ignored news driven false exuberance tends to hold sway.
Summary: selling can commence as early as tomorrow, but next 1-2days barring another news-driven over-demand, and for an STC 3-5days of %2%-4%.
Forecast 52: 12October2012

Oracle corporation prices (red, scaled) closing=$31.00 ..the graphs of excess demand from prices graph1 and excess demand from peaks&troughs graph2 show the roll-over of demand however the momentum of the recent overdemand and its correction is carrying over and selling is expected as early as monday but high probability tuesday for 1-4 days ~2%-3% conservatively.
Forecast52: 12October2012
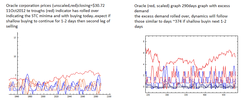
Oracle prices closing=$30.72 P&Ts peaks&troughs graph1 with 3days windowed averages indicating a trough formed by STC dynamics however this as to be confirmed over the next 1-2 days with more than shallow buying, which if occuring indicates we are in an over-demand correction and a further sell-off of a 2nd leg similar to the recent ~90days LTR cycle.
The excess demand (ink) graph2 is indicating the similar dynamics, with over-demand correcting and moving averages crossing-over but with room for more selling..if shallow buying occurs next 1-2 days it will result in a slight up-trend in excess demand, not affecting the moving averages overly, which would be followed by more selling..however strong buying would alter this dynamic shifting it to the STCs dynamics as we have mentioned before in previous recent forecasts..
The excess demand (ink) graph2 is indicating the similar dynamics, with over-demand correcting and moving averages crossing-over but with room for more selling..if shallow buying occurs next 1-2 days it will result in a slight up-trend in excess demand, not affecting the moving averages overly, which would be followed by more selling..however strong buying would alter this dynamic shifting it to the STCs dynamics as we have mentioned before in previous recent forecasts..
Forecast52: 12October2012

Oracle prices graphs of excess demand from prices and susceptibility from P&Ts..the dynamics are those of an over-demand correction currently..if buying is shallow next 1-2 days this will be furter confirmed with expected 2nd leg selling and continued downwards correction.
Forecast 51: 10October2012

Oracle corporation (red, scaled) prices closing=$30.58 ...the graph1 is the excess demand from prices (not P&Ts) and it is dynamically similar to the trough of the 1st leg of the recent ~90days LTR on the unscaled graph ~90days ago or towards the beginning of the graph1 and the middle of graph2.
The over-demand correction dynamics is also shown in graph2 by the susceptibility from P&Ts(not prices) ...both are expected if shallow buying occurs next 1-3 days towards~$31.00 strike price to follow the sell-off dynaics, that however can shift to STCs dynamics if strong buying occurs or revert to sell-off faster if strong selling continues or resumes.
Summary: see next graphs for direction and timing
Summary: we are following an over-demand correction dynamics that similarly to its formation switches and potentially switches back and forth between sell-off and STCs short term cycles...it has to be followed closely, and it is as iterspersed by several legs only after the first leg that one can actually call it a sell-off correction...however as the over-demand was preceded by a strong selling week the larger picture is that it isthe second stage in a sell-off yet to be considered as part of the ~90days corrections, however possibly the pre-cursor to a large crash an unlikely though statistically significant possibility.
Forecast51: 10October2012
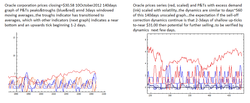
Oracle prices series closing=$30.58 and excess demand ...the 3days windowed averages of P&Ts (blue&red) graph1 are rolling over and transitioning upwards towards a cross-over (red) indicating a near trough and an up-tick to occur next few days 1-3 days. The excess demand(ink) in graph2 is also rolling over and independently indicating the same.
There is however a rare occurence , well occuring...the conditions were such last week that an over-demand occured, to which the response is i) strong selling or ii) interspersed with shallow STCs-like buying but several legs of selling , or iii) strong selling abruptly terminated by strong buying usually prompted by external dribving such as fed intervention, news etc.....currently we are in scenario ii) , but as the over-demand fluctuated between over-demand formation and STCs dynamics, so the over-correction will fluctuate between sell-off correction and STCs-like dynamics. The gauge will be the next few days...if shallow buying towards~$31.00 by friday 12Oct2012 followed by further selling monday or tuesday, we are probably seeing thesecond leg of the sell-off of the over-demand response...if however buying occurs shallowly at first (as market-makers will want to pin the options expiry price at or near ~$31.00 ) then buying continues past monday and or strongly, then thesell-off will have been in terrupted , however with further selling an STC or two later, as the ~90days LTR correction which we know we are in however sporadic continues...
Summary: much details, however expect selling until ~10% of the recent highs of price reduced a bottom is reached...the detailsactually the timing and magnitude, and as a wise (and probably wealthy) man once remarked " timing is crucial to succes in the markets".
Check direction before trading.
Forecast 50: 09October2012

Oracle corporation prices (red, scaled) and P&Ts peaks&troughs (blue&red) 3days windowed averages graph1 09Oct2012...the trough indicator has rolled-over indicating beginning trough forming, however there is room for more selling.
Summary: trough forming 1-2days , samerecent range of selling...however note that efforts are being made to quench any perceived sell-offs by major market movers and central banking...expect deviations from over-demand corrections. Either way check direction before trading and utilize insurance puts if you're still purchased bullish. Oh...it is timeslike these that we miss the steady ups-and-downs of STCs...
Note: a crash is possible, as early as tomorrow. a major, economy meltdown sized crash. We are in dynamics of correction to over-demand, yet we shifted back and forth from STCs to over-demand before strong selling occured...that with the lower over-demand that did occur implies lower sell-off correction, yet with possible reselling in an STC or two later. However we have another LTR long term risk condition potentially looming..it combines low volatility, consensus of regular dynamics these including bullishness, STCs, even regularly scheduled corrections, and mis-timing even by predictors of catastrophes...certain analysts hedge the bet by simply stating that it is imminent from tomorrow to 180days from now and others within a year (or two)...we find that some researchers are discovering indications of potential trigger points in December, however the same method allows for several oscillations either way so we are still currently potentially vulnerable...add to this a curious fact..a large number of historical crashes have occured in October....We suggest purchasing puts to insure any potential downside.
Forecast50 : 09October2012
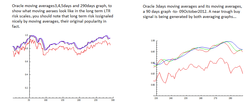
ORCL moving averages...the long term signaling is actually useful and has recently signaled selling...for more detailed analysis see our proprietary indicators,
Forecast 50: 09October2012

Oracle prices time series (red, scaled) closing=$30.65 09Oct2012 140days graphs of P&Ts (blue&red) with moving averages and graph2 excess demand from prices (not P&Ts).. The selling currently is expected to exhibit two dynamics, of over-demand correction (strong sustained selling) , and interspersed buying ranging from inter-STC short term -like cycle to aseveral days of buying resembling an STC however but a respite from the selling correction. The second graph is excess demand, which reached rare highs prior to correcting with strong selling..if the dynamics of a correction are accurate and though of a lesser magnitude than the recent ~90days sell-off indicating possibly two or more separated sell-offs, then there is more room for selling, with a bottom of the correcting demand yet to be reached, a re-formation of demand and consensus, then a formation of a price bottom (if a single sell-off of two or more legs or STC-like surges) see previous correction towards the first few days of the graph2.
Summary: room for at least 1-2 days of selling before a trough with proportional-to-overdemand is formed...similar range as recent 3days of selling ~0.6%-2%. Check direction before trade next few days as once sell-off conditions dawns on the major players efforts will be made to quench the selling, possibly as early as tomorrow.
Summary: Did you know that historically large crashes have occured 10/13 times in October (excerpted from recent yahoo.com finance )..We are currently studying these statistics and dynamics, from occurence rates , volatility levels (low as measured by std. dev. or vix), to large scale applications of our proprietary indicators.
Forecast 49: 08Otober2012

Oracle prices losing=$31.18 (red, scaled) 08Oct2012 140days graphs of peaks&troughs (blue&red) and moving averages and in graph 2 excess demand (ink)...the two preceding days of strong selling is expected to continue for 1-3 more days with trough forming by wednesday 10Oct2012 if dynamics of STCs short term cycles and excess demand are continued without a) news perturbances b) LTR long term cycles risk of sell-off or extremes of a crash, both being predicted by analysts. Insure the downside of your trades and check direction before trading.
Summary: trough forming, by wednesday at ~$29.60 conservatively, to be followed by up-ticks and a further stronger STC selling for net cycles.
Summary: There are several papers including several of ours and the proprietary indicators we have developed from them (some papers here cited in our web pages) that state that a crash occurs when complacency sets in, and consensus forms an 'illusory' bull market with a near deterministic up-trend..the STCs volatility measured by stand. deviation approaches its minimum near zero as other windowed averagings reach minimums, or by weighted futures such as the VIX volatility index lows such as the ~$10 in 1987 preceding the final leg of the up-trend that then resulted in a ~50% crash, or the intermediate levels for medium term LTRs long term risk such as the recent ~90days cycles which we are at the near peak of in prices and near the volatility VIX lows ~$15.11. We therefore expect a continued selling this or the next few STCs if the VIX measured dynamics are yet applicable...also see our recent forecasts utilizing excess demand prices and susceptibility.
http://finance.yahoo.com/news/way-look-vix-204235936.html
Forecast 48: 05October2012
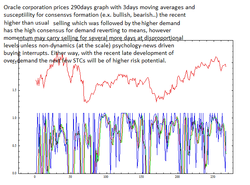
Corporation Oracle (red, scaled) prices susceptibility ...we show these technical indicators as they are of the dynamics of demand and consensus formation, the generators of price dynamics, and are useful for quantifying at our level and qualifying at the level of our freecasts readership the markets' LTR long term risk. Currentlly we are going back and forth between STCs short term cycles' dynamics and LTR long term risk sell-offs down-turns corrections dynamics......reminder that ~90days LTRs cycles are still risky. See next graph for directionality forecasts.
Forecast 48: 05October2012

Oracle Corporatio (red, scaled) prices 140 days graph1 with P&Ts peaks&troughs (blue&red) indicators. The current over-demand though not sustained was sufficient to cause strong selling today. The down-trend indicator is transitioning as the momentum averages indicator (red) however is yet below averages indicating more selling to come by dynamics, however this could be interspersed by up-wards fluctuations or altogether news driven resumption of buying.
The excess demand from prices data (not P&Ts) was also at above average highs, yet with the strong selling...dropped 'strongly'. The momentum by moving averages however is yet at lows and therefore is also indicating continued selling by dynamics.
Summary: The over-demand implies a continued strong selling , however efforts have been made to quench just such a selling, therefore check market direction or news driven or expectations before trading next few STCs , trade for longer term insuring the risk downside, or stay out altogether until resumption of STCs assuming no sustained LTRs selling occurs.
Forecast 47 : 04October2012

Oracle corporation prices 04Oct2012 closing=$31.88 ..the P&Ts peaks&troughs (blue&red) indicator transitioned upwards towards rare highs that has only occured 6times in 14months, indicating a higher level of upcoming selling as over-deand adjusts by over-selling..if a continued buying occurs tomorrow , an unlikely yet significant probability, the over-demand will flatten yet continue at the highs, and the response will be yet a higher level of selling..this unlikely continued buying will only occur for a potential two more days, to be followed with a ~10% sell-off and less with less buying days...an eighth and nineth day of buying is at a ~2/1107 twice in over a thousand days to put the out-liers or fat-tails into a numerical perspective for our readers. Scroll down to our data of random matrix theory and histograms and or click on the capabilities pages for more data.
Summary: selling if commencing tomorrow is ~4% peak to trough, if another day of buying commences tomorrow unlikely though of significant probability of occuring, the selling will be ~6% and for a seventh day ~10% of shallow buying STCs-like plateaus.
Summary: We are not near the clear peak-triggered sell-off that occured ~90 days ago, however we are near the two or more consecutive larger than mean STCs selling that totaled similarly in previous LTRs, and if continued buying occurs we can easily transition to the most recent LTR levels of over-demand. Check direction pre-market before trading tomorrow.
Note: for our new coverage of the Long LTRs a.k.a. 'economic melt downs' and 'crashes' , please keep following our newsletter and forecasts, bookmark our pages..also we are considering devoting a separate page collecting our and other researcher's findings, for an example the previous day's forecasts and notes.
Have you heard....LTR long term risk news
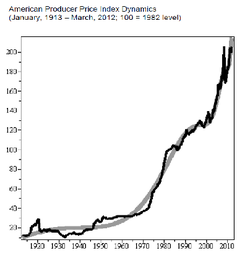
Have you heard? a team of researchers using LPOs log periodic oscillations on data from the U.S. "American Producers Price Index" index ~1913-2012 has found that the critical point for the next economic melt-down is lunch time 17th December 2012 some time between dessert and that second cup of coffee...
http://arxiv.org/abs/1207.4069
We mention what we feel is very important research due to the following facts...the ~4year cycle of economic melt-downs which the past two ~2002 and ~2008 were ~50% drops in the S&P500!!, and which is 'known' to be imminent, is almost upon us...'almost' meaning between tomorrow and the next year as '~4years' is an approximation with a suspenseful leeway for complacency.
We also mention this as we are mathematical physicists, we know that LPOs log periodic oscillations are the signature of an imminent phase transition such as from water to ice, from liquid glass to amorphous solid glass, from quiescent peaceful countryside to earthquake ravaged disaster zone, from amino acid chain to folded biomolecular protein...we have been searching for the physics of this observed type of predicted behavior in the S&P500 and member stocks, as the physics by our very own theoretical models of interacting many-traders is that of a phase transition theory, the excess demand model...unfortunately a clear LPOs signal similar to the excerpted without permission advertisement graph (for the cited authors' paper) is masked by several factors from organizational time-scales to damping...as such and though we have found an LPOs -like increase in amplitude of oscillations, which we showcased in previous forecasts on LTR long term risk, we have yet to find the S&P's LPOs of a decrease in period....which terminates in a critical point predicting the next ~4year 'melt-down' or frustrated phase transition or crash. As soon as we do we will let you know. In the meantime we have our regular excess demand indicators and other showcased indicators themselves capable of signaling peaks-before sell-offs and real bottoms of even large transitions such as crashes. Given these and known ~50% intimidating sell-offs maximums of previous magnitudes, known durations ~2years from peak-to-trough-to-peak crash to recovery, known ~4years cyclical nature of the historical crash dynamics and now a highly effective 'observational by analogy' statistical LPOs fit of 17th December 2012, we advise that one plan accordingly. By the way, we will utilize the definition of a crash commencing of an ~9% selloff in approximately eight ~8 days if near the ~90days correction cycles.
Forecast 47: 04October2012

Oracle prices 04Oct2012 closing=$31.88 ...the 3days windowed P&Ts peaks&troughs indicator (un-scaled) isat a rare high, seen only 6 times in 14months, with potential sell-off siilar to continued ~90days LTRs long term risk cycles occuring if sustained. A sell signal has been generated, in fact a day ago, however investor risk preference as adjusted to news driven economic events has continued to buy and measured short term demand has transitioned upwards to highs rarely seen.
Summary: last chance for STCs short term level cycles magnitude selling...if commencing tomorrow, ~4% from peak to next trough 3-5 days...if after market a.k.a. premarket buying continues this ay be heightened and stretched respectively, and the converse being true check premarket directions before trading.
Summary: If buying continues tomorrow through the day following, even if flat, the demand will remain at transitions highs, shown elsewhere the sell-off will be heightened as well, to ~6%-8%.
Summary: will forecast the trough as it occurs in any event.
Forecast 47: 04October2012

ORCL prices closing=$31.88 04Oct2012...the graph1 is susceptibility of consensus formation by price data, of ~250days, showing ~90day cycles and what suscep scaled with volatility resembles, as we have been utilizing it for STCs short term cycles forecasting and we thought you might want to see its dynamics in previous cycles...non-volatility scaled susceptibility and excess demand is another matter for another discussion..
The second graph is the excess demand scaled also with volatility using prices series as data inputs...the levels of demand have dynamically evolved sufficiently for a heightened selling, as we have been considering.
The second graph is the excess demand scaled also with volatility using prices series as data inputs...the levels of demand have dynamically evolved sufficiently for a heightened selling, as we have been considering.
Forecast 46: 03October2012

Oracle corporation prices (red, scaled) and P&Ts (blu&red) peaks&troughs indicator 100ays graphs..the continued buying occured despite the low yet significant dynamics probability of it to occur, however given the recent psychology and news driven market events, such as the U.S.' QE3, the Euro version of the QE3, and the 'final piece of the puzzle' (excerpted quote) China's 'fed' version of the QE3, we had a pull-back from what was beginning to resemble the ~90days cyclical LTR long term risk correction, now with a near highs levels of short term cycles' excess demand (graph2, ink) and the peaks indicators transitioning to rare demand highs, somewhat similar (yet again) to the 'rare demand highs of ~90days ago and the ~11% sell-off correction, which condition of over-demand will occur if the following occurs (we performed some scenario simulations to calculate these, however it is easily visualized as it resembles the high peak in demand immediately preceeding the recent correction of ~90days ago ):
1) given tonight's POTUS election debate, expectations of 'exuberant' buying by traders tomorrow who are predicted to hear what they want to hear has been 'announced' by analysts(?)...a 5th day of buying would drive the over-demand levels yet higher.
2) a friday ending the week on a high note of another buying day will bring the already high excess demand levels to the almost exact levels of the over-demand that triggered the last sell-off correction.
3) post week-end thoughts on the economy will then 'revert' to a selloff and a higher than mean level as demand over-corrects to the sell-side.
-Or- the already signaled sell at the peak level and with excess demand momentum dynamics shifting, will occur tomorrow or the next day following the debates and the news driven deviation from dynamics irregardless, and 3-5days STC short term cycle will occur...a nice dynamics driven cycle of ~3%-4%.
Forecast 45 : 02October2012
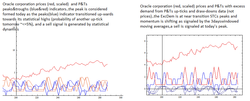
Oracle prices (red, scaled) 02Oct2012 100days graphs of P&Ts peaks&troughs (blue&red) indicators graph1 , excess demand(ink) graph2 with 3day moving averages...
Summary: short term demand cycles' momentum shifting graph2(ink) indicating momentum change or a peak in STC short term cycles' peak and a sell-signal trading opportunity.
Summary: peaks (blue) indicator of up-wards price dynamics transitioned to statistical levels of highs indicating a peak formation and a sell-signal..forecast selling tomorrow ~1% and an STCs 3-5 days until next trough with total ~3%-4% selling.
Comment: Looking at the statistics of STCs with which our proprietary indicators are quantified and or correlated, you will note there are small yet not insignificant probabilities of fluctuations, as such though dynamics indicate a peak, there is yet a small though not insignificant probability of another up-tick of ~0.03 or 3%, and this by statistical dynamics..by investor psaychology and external perturbations of news driven markets 'exuberance' can be generated simply by a speech by a central banker, an equities marketing campaign and so on..we mention the up-sideyet the same can occur for down-turns.
Forecast 43: 01October2012

Oracle prices 3daywindowed P&Ts peaks&troughs , the transition of the demand indicator or buy-side indicating a peak forming today or with a small yet significant probability tomorrow by dynamics..by psychology or news driven fluctuations outside the dynamics may occur, meaning is there a 'rally' that might occur past today and tomorrow's peak? not likely and for the 'economic uncertainties' reasoning of the news drivel markets..check direction before trading.
Forecast 43: 01October2012
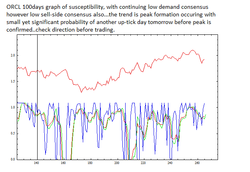
Oracle prices' excess demand from prices (not P&Ts data) ..the near mean levels indicate wariness or caution...trend is towards a peak formation today or tomorrow.
Forecast 41: 28September2012

Oracle prices (red, scaled) excess demand and susceptibility 100days graphs..the recent 2days strong buying has increased the excess demand levels, and susceptibility away from lows..the buy-side has to continue to up-trend for the next 1-2days which will further the susceptibility for consensus formation away from the near critical levels as either high excess demand which can over-correct triggering a sell-off or lack of demand which can down-trend towards a sell-off can be a LTR long term risk...the other signal similar to the over-demand over-bought signal is the over-sold signal which resembles the over-demand as a large increase yet is over-reacted to by a bullish buy-off as infrequently as that happens...however look for continued buying to, though shifting the dynamics away from the third leg of the LTR ~90days cycle -like sell-off, to merely delay and strengthen the continuance of the ~4%-6%(conserv.) sell-off in 1-3 STCs short term cycles.
Summary: 1-2 more up-tick days (monday if a buy day most likely) will sharply provide a peak formation and a sell signal ~3%-4% peak-to-trough in 3-5days. More importantly it will be a signal that the sell-off potential was quenched (not entirely correct) and that STCs short term cycles will have resumed. If selling resumes monday due to what investor psychology-global-analyst-what-have-you it most likely will be for the remaining third leg now increased in magnitude to ~4%-6%.
Summary: If the buying does resume for 1-2 days, and then STCs, expect a potentially similar sell-off to occur in 1-3STCs, with a final bottom ~3%-5% above recent LTR bottom.
Note: We are interested in the Long LTRs long term risk of the years duration..for example the ~2007-2008 'crash' that dropped the value of the S&P500 by ~50%, and previously in ~2002 by again ~50%...we are utilizing the scale-able theory of excess demand applicable from seconds to years, or several orders of magnitude, to track the potential of an early 'down-turn' or 'crash', which the most wary analysts are predicting to be at any day to 180 days, to a year or more from now. The dynamics will be not surprisingly very similar to the dynamics of the LTR long term risk, however with another emergent property...news such as quarterly fed meetings and earnings surprises will be not-news, but statistical outliers within the standard deviation of the theory when viewed over an 11years ~3100days data...historically dependent stochastic dynamics will have a scale of years as shown by several researchers for the S&P500..at such time scales of organization of 400~600days of several indices (higher frequency organization also occurs as mentioned elsewhere) certain features of the excess demand theory, a critical frustrated phase transitions -like theory from the physics (hoy!) should become noticeable such as the pre-cursors to a crash or a bubble the LPOs log periodic oscillations as certain details become coarsely averaged...We will begin in the near future to feature analysis of the long LTR long term risk as it begins to become more likely that it may occur. We can thus far predict the peaks and troughs of LTRs within the multi-year dynamics such as the onset of the 2008 crash, and will be able to both correlate that with random matrix theory and with excess demand near-critical conditions such as the over-demand and under-demand, the over-sold condition not the crash onset but the crash recovery condition.
Forecast 40: 27September2012

Oracle prices..strong buying today changed the dynamics yet again, from similar to the third leg of the LTRs sell-off of ~90days ago, and if strong buying continues tomorrow and it has the possibility of as the Chinese state equivalent of the U.S. fed performed its own version of QE3, then the dynamics resemble those of an interrupted sell-off that yet has the potential to re-occur for a further ~6% sell-off in two or longer STCs short term cycles.
Forecast 39: 26September2012
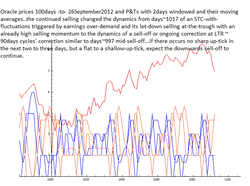
Oracle corporation closing=$30.73 26Sept2012 100 days graph..the 2dayswindowed P&Ts peaks&troughs (blue&red) and moving averages..the upwards re-transition of the troughs sell-side indicator in mid-STC short term cycle indicates that in the stead of the fluctuations during the STC up-wards trend similar to days~1017 the continued selling has changed the excess demand dynamics to the sell-off correction dynamics similar to days~997. This could have been avoided simply by today's buy-side up-ticking, however renewed selling following post earnings over-demand and its over-correction coupled with the larger economic 'outlook' has been motivating selling.
The correction similar to ~90days cyclical LTR corrections is a ~10% sell-off, occuring in 2-3surges of ~3%-4% selling, interspersed by flat trading and shallow and short up-ticks...this pattern is currently ~2/3 occured, as the over-demand caused by earnings occured after hours in a short few hours however occured at a trough of ~3% decline, the over-reaction to the over-demand causing what seems to be a selling reaction of the further ~3% where we are currently...note that other factors occured simultaneously with this occurence at or near the ~90days cycle LTR long term risk we have been repeatedly warning about and providing detailed analytics of the quantification of the risk of, such as overall economy concerns as measured by S&P500, and analysts and psychology concerns as post-fed generated 'exuberance' corrected, leaving what should be what support levels QE3 placed into effect and into the markets as the foundation of any further near future up-trends rallies bullishness etc.. .
The current shift from a longer-than-mean STC that had fluctuations or selling days interspersed as it trended towards the albeit predicted shallow next peak, to a continuous selling (today must have been an up-tick day to prevent the troughs sell-side transition signal) then is beginning to resemble the 'third leg' of the ~10% correction of the recent LTR long term risk.
<%2
Forecast 39 : 26September2012
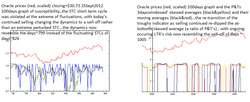
Oracle prices 100days graphs of susceptibility 3dayswindowed and skewed averages of P&Ts tracking potentially on-going correction.
Forecast 39: 26September2012

Oracle prices 2days and longer susceptibilities of consensus of demand conditions from prices data...the different scales high-light different ranges of the dynamics of the inter and intra STCs short term cycles thereby signaling several features of the on-going potentially correction sell-off.
Forecast 38: 25September2012

ORCL prices 25Sep2012 closing=$31.30 ..the excess demand and susceptibility of consensus formation from prices data..both indicating low levels, which after fed intervention and caution served to both support demand yet quench over-demand..for now. The current levels are similar to recent STCs where the up-trend was interspersed wiith large down-side fluctuations..see graphs.
Comment: Recent earnings over-demand and reversion-to-the-mean though occuring in a few hours, affected psychology of ORCL traders investing and therefore STCs..that is earnings 'enthusiasm' over-bought luntil excess demand (over-demand) drove the price upwards by ~3% increase after hours which after the opening bell sold-off completely reverting to the levels of demand and perhaps overcorrecting..no entry point of the expected profitable buying opportunity (as it was selling-off after the opening bell counter to the buy signals) remained for regular trades for major stocks investors translated to the next day's more selling, though the up-tick had occured as forecasted on the 21Septeber2012 as by the closing bell the price has up-trended by ~$0.90...this fluctuation is expected to continue until the peak and next STC.
Comment: Recent earnings over-demand and reversion-to-the-mean though occuring in a few hours, affected psychology of ORCL traders investing and therefore STCs..that is earnings 'enthusiasm' over-bought luntil excess demand (over-demand) drove the price upwards by ~3% increase after hours which after the opening bell sold-off completely reverting to the levels of demand and perhaps overcorrecting..no entry point of the expected profitable buying opportunity (as it was selling-off after the opening bell counter to the buy signals) remained for regular trades for major stocks investors translated to the next day's more selling, though the up-tick had occured as forecasted on the 21Septeber2012 as by the closing bell the price has up-trended by ~$0.90...this fluctuation is expected to continue until the peak and next STC.
Forecast 38: 25September2012
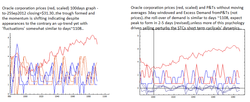
ORCL prices closing=$31.30 ... the P&Ts peaks&troughs (blue&red) 3days indicator and moving average are yet to resume the trend upwards following the 21Sept2012 up-tick which commened at mid-day following the pre-market ~3% earnings price buying increase and its subsequent complete sell-off by mid-day to closing 20September prices...the STC short term cycle up-trend re-commenced after mid-day, and when the closing bell rang the up-tick was for the 'modest' ~0.9% , with a continuing STC up-trend projected.
However the earnings artificial prices inflation by over-demand was a perturbing effect on the STCs short term cycles dynamics and caused a fluctuation in prices (selling contrary to the inter-STC up-trend) similar to days ~924.
The prices are expected to trend upwards towards the peak in 1-5days, with the 'extra' long STC due to the fluctuations of selling as the up-trend is expected to progress towards the next peak.
Summary: trend is upwards towards the next peak ~2%-2.5% expected 4days with fluctuations or selling days interspersed. Check market direction before inter-STCs trading.
Note: The psychology of markets is a perturbation upon the dynamics, however when one increases the scale the psychology of an earnings price increase is just a statistical occurence itself quantified as a fluctuation of the dynamics...however at this scale and with recent noted LTR long term risk of the ~90days cycle combined with external i.e. fed support of a perceived weakness in the economy possibilities of non-dynamics that is not-well-pre-signaled selling can occur, as for example a news event can cause selling or buying not predictable at the scale of the STCs' statistically correlated and quantified rates of occurences magnitudes durations and the cyclical deterinistic portion of the dynamics... yet even these extreme events can be predictable statistically, see for example RMT random matrix theory and its quantification of extreme events and their effects, for example 9consecutuve buy or sell days occur just 2/1107 twice in ~10years, and of magnitudes clustered sharply around $0.20/day, with extreme changes of $1.00-$2.00/day occuring with a probability of less than 5%. These extreme 'outliers' and lesser ones are statistically significant, and are notably the occurences of large losses or gains, in the case of losses causing accumulated small gains to be reduced. How does one avoid these? by continually insuring one's trades by derivatives, by being close to one's money and trades and utilizing other automation methods of following limits, and by diversifying portfolios in several sectors of investment. The LTR long-long term cyclicals of years are also however resonantly affected by news that then have an amplified effect on the prices of markets, and it should be noted that the resulting outliers and large markets movements are products of both the cyclicals and news perturbations...we quantify statistical fluctuations with cycles of dynamics, and as such we can note when vulnerability to external news is at its highest, by the methods of excess demand and susceptibility to consensus formation and we forecast these. Currently LTR long term cycles are showing low susceptibility, implying low vulnerability to amplified effects of external perturbations such as news, and implying the STCs short term cycles dynamics are operating...it will be interesting to note whether these are perturbed over the next few days implying a higher potential for a sell-off with anny continuing STCs violating downtrends.
Note: Given resilience to news perturbations at low susceptibility, dynamics of supply and demand must operate..despite earning over-buying and over-reaction, at the current levels of demand for the ORCL stocks with re-iterated outperform ratings and so forth, a level will be reached when consensus begins to build again that it is over-sold and a lucrative investment and buying up-trends will occur, these are the inter-plays of fundamentals, statistics and psychology of risk aversion.
Forecast 37 : 24September2012
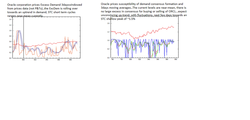
ORCL Excess Demand...the current levels are near-the-mean..this means reduced risk of LTRs long term risk events such as larhe scale transitions, however it also means unconvincing up-trends interspersed with fluctuations and shallow peaks and so forth.
Forecast 37: 24September2012

Oracle corporation prices..3days windowed P&Ts and averages graph1 and Excess Demand from P&Ts (not prices) graph2..the trough formed after hours thursday 20Sep2012, the uptrend on 21Sep2012 was manipulated by earnings frenzy, with supercomputed and analyst projections buying a ~3% increase during after hours which then sold-off ~3% during market hours, resuming an up-tick per STCs by midday to closing bell. This price manipulation has an added effect, it distorts indicators and investor and trader psychology temporarily..we then see the alreadly probable fluctuations even during an STC up-trend occuring with a higher-than-mean likelihood..expect a fluctuating and unconvincing up-trend to the shallow peak ~1.5%-2% that will likely form ~3-5days from now. View our pages regularly next few days for signs eaks (blue) upwards transition signaling surge in demand and buying and next peak formation and the roll-over of the moving averages (blue) indicating momentum shift and signaling the peak.
Forecast 36: 21September2012
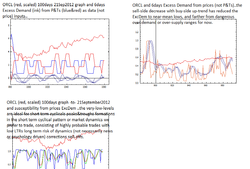
Oracle corporation prices (red, scaled) the 6days windowed P&Ts peaks&troughs 100days graphs with Excess demand from P&Ts graph1 and from prices graph2 and the susceptibility graph3..the levels of the excess denand are not that far from the near-the-mean levels indicating no elevated LTR long term cycles risks currently, an indication that STC short term cycles' risk levels are conducive to P&Ts trading signals without interruption by large scale etransitions such as over-demand or over-sold conditions of sell-offs or rallies occuring. This assuming no artificial price manipulation such as the options expiry, earnings reportings days, psychology-of-the-markets affecting 'news' such as fed intervention, news of catastrophes or serendipitous discoveries and similar external perturbing effects. As always one is expected to cover the down-side of risk whether by simply staying close to one's money and exiting at the first sign of risk or by sophisticated insurance schemes such as Black-Scholes valued options and puts and other derivatives.
Note: we are mainly providing free market forecass of tech stocks as exemplified by ORCL and MSFT..if you require derivatives analytics another published expertise of ours with innovations such as nonextensive statistics derivatives pricing, generalized Heston stoch. vol. models, contact our sales staff.
Note: we are mainly providing free market forecass of tech stocks as exemplified by ORCL and MSFT..if you require derivatives analytics another published expertise of ours with innovations such as nonextensive statistics derivatives pricing, generalized Heston stoch. vol. models, contact our sales staff.
Forecast 36: 21September2012

Oracle corporation prices (red, scaled) closing=$32.53 100days graph -to-21Sep2012..the trough has been confirmed as formed graph1 as moving average cross-over with the trough indicator upwards-transition (red) , the expected trend is upwards by ~2-3% in 3-5days with fluctuations during the up-trending portion of the STC short term cycle
Forecast 36 : 21September2012

Orac le prices series (red, scaled) closing=$32.53 ..the P&Ts 6days indicator signaling the formed trough and upwards trend confirmed today by mixed trading that began premarket at ~3% higher than yesterday's closing prices, and which after the opening bell the prices dropped sharply ~3% by mid-day to yesterday's closing=$32.26 , after which sensibility seemed to re-set itself and the STCs short term cycles re-commenced with upwards ~1% up-tick by closing bell.
Summary: up-trend to continue towards a peak formation 3-5days of ~2% or ~$33.10, however expect fluctuations during the STC.
Note: the premarket high of ~3% up-tick was due to several factors, including the 'quadruple witching blah blah' and the chartist near-buy signal generated yet pre-acted upon..the near-trough was yet to dynamicaly form, however news of earning for
ORCL precipitated speculation based on previous earnings cycles rise in the stock price..however it occured with such pre-mature professional trader speculativeness that only after-market traders were able to speculate, drive up the price by ~3% and then when the vast majority of traders came to the market by opening bell, the profits margin were all 'used-up' and there was no risk-minimized' trade available...sell-off commenced, with a trough forming was dynamically expected to by mid-day and with the earnings speculation during after hours a high-speed mini STC of sorts...the trough confirmed by mid-day, the up-trend portion of the STC re-commenced towards the next peak.
Forecast 35: 20September2012
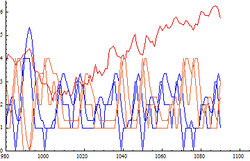
Oracle corporation prices 20September2012...100days graph, P&Ts peaks&troughs (blue&red) and 3day windowed moving averages graph1 indicators are showing the trough forming... by transitions of trough indicator upwards...however the true bottom of the trough has not been formed yet or confirmed.
Summary: Trough forming, will probably (statistically) form tomorrow in mixed trading, with an end-of-day closing prices at near today's or if direction shifts early at slightly higher.
Summary: If shallow selling does occur the optimal risk aversion by traders, the true bottom will form, with our indicators then signaling sharply the trough and the buying opportunity..if traders jump the buying early as possible due to mixed signals and low-resolution chartist traders analysts approaches, the trough will be confirmed mid-day..as we do not service inter day trading, make sure to confirmn directionr at the traders sentiment before trading tomorrow, or stay out altogether and wait for the confirmation of the STC up-trend of the following 3-5days.
Forecast 35: 20September2012

Oracle corporation prices data as input to Excess Demand theory graph2...the levels of demand are to be watched however are near-the-mean..the Excess demand (ink) graph1 is the ExcDem from P&Ts data (not prices) and is indicating more romm to the bottom however we expect an early jump to buying by traders as occurs with mixed signals...see moving averages next graphs.
Forecast 34: 19September2012

Oracle corporation prices (red, saled) closing=$32.81 19september2012 100days graphs...P&Ts 3days windowed peaks&troughs (blue&red) indicators and their moving averages graph1 indicating a quick trough formation occuring as troughs (red) indicators transition upwards and the troughs (red) averages roll-over towards an upwards cross-iover indicating momentum shift at the direction change and therefore a trough or bottom formed in this STC short term cycle of peak-to-trough-...graph2 Excess Demand (ink) also rolling-over towards the mean and towards the next trough formation.
Summary: Trough forming next ~1-2days will be signaled by several of our proprietary indicators..advice hypothetically would be to stay out until then unless you are an STCs cycles trader (one who sells at the peak and rides the down-trend until the trough, as opposed to one who sellls at the peak for only the most probable day of selling).
Note: We provide signaling trading trends information for informational purposes..if we were to provide trading advice which we do not(!), we would be advising that using indicators such as ours which are the most accurate near the peaks&troughs therefore the least risky and highest probability trades are at the pin-pointed peaks&troughs...there are sufficiently ~10-14 such high probability trades per-100days (on average) (thus far since we went live with our freecasts we are 100% accurate directionality and timing and ~75% accurate magnitudes and ranges!) trades per 100days such that ~40-50% total return stocks trades and averages of ~70% per trade! returns utilizing (disclaimer: high risk ) options strategies have been possible. Summary: stay out until peaks&troughs clear signals are made, and be watchful of LTRs we track, see next graphs.
Forecast 34: 19September2012
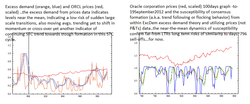
Oracle orporation prices (red, scaled) 100days graph -to-19September2012 and Excess demand theory with prices (not P&Ts) as data inputs..the current near-the-means excess demand ExcDem tells us we have moved further from the LTRs long term risk such as days~896. graph2 is the susceptibility 6days windowed and moving averages from the ExcDem , and it also has rolled back towards mean range...for now.
Summary: the recent re-instated cautious buying following last week's post-fed 'exuberance' and quick peak formation followed by selling did what we suggested should be done...it dampened a run-away over-demand condition with its inherent risks of a correcting reversion to-the-mean or a run-away sell-off similar to days ~896...for now.
Summary: the recent re-instated cautious buying following last week's post-fed 'exuberance' and quick peak formation followed by selling did what we suggested should be done...it dampened a run-away over-demand condition with its inherent risks of a correcting reversion to-the-mean or a run-away sell-off similar to days ~896...for now.
Forecast 33: 18September2012

Oracle prices closing=$33.06 adjusted...the 3days P&Ts peaks&troughs (blue&red) moving average crossed-over the peaks(blue) indicator indicating peak formation...this following cautious buying yesterday and a mxed day today ending near yesterdays closing of $33.10...the caution is commendable and reflects knowledge of the higher-than-usual risk of this LTR long term risk cycle of ~90days which we are near the extreme point of..see forecast5 for historical graphs, note the near end points of highs...
The caution then is dampening or quenching the runaway buying and its overdemand condition and subsequent elasticity backlash reversion to the mean that is a potential sell-off or correction. This does not mean that a series of STCs short term cycles sells of ~3% interspersed by shallow buys won't descend the staircase towards some corrected market value, however the ~10% drop in a week or so of trading days is to be avoided, the sell-off of the correction ameliorated and other damaging facets such as to investor psychology avoided or prevented.
Summary: peak formed and confirmed by close of trading today, tomorrow expected a sell downtrending towards a trough or an STCs short term cycles bottom of ~2-3% in ~3-5days..if we were not near the LTRs, and we are recommending staying away from the markets one or two weeks until the LTR cycle issue is resolved and with the plethora of highly probable trades available inter LTRs you really wouldn't be missing out much..., then we would be informing you that a sell signal was generated today expecting a drop in prices tomorrow to ~$32.85.
Note: See the ExcDem and Suscep graphs for supporting data of a lack of an overdemand condition a pre-requisite to a peak triggered sell-off.
Note: We ran several simulations of the peak-triggered sell-off scenario..If market-makers and traders ignore the selling opportunity of STC levels of demand and re- commence to buy in some un-realistic re-surgence of buying without taking into account the STCs dynamics that tell them to otherwise sell, that is without taking into account volatility and therefore their own risk exposure, then it will yet take 2-3days of at-the-current levels of demand (not price, the price can yet remain at current levels of ~$33.10 for 2-3days and an over-demand would yet occur!) to spike demand levels to over-demand conditions similar to the previous ~90days LTR long term risk peak-triggered sell off correction to the over-demand.
Summary: If you must trade tomorrow, then we are indicating a sell signal, that for information only, and which direction should be confirmed prior to entering into the trading. If due to perception a follow-up sell-off occurs it will not be a dynamics driven sell-off but a psychology driven one and shallower than previous sell-offs.
Forecast 32 : 17 september2012

Oracle prices (red, scaled) 100days graphs and -to- 17sept2012..the closing prices=$33.10 ...the 3days P&Ts peaks and troughs (blue&red) and the moving averages graph1 are indicating a 'forming' peak, yet the moving average has yet to 'cross-over' indicating a momentum shift or a peak formed...the excess demand from P&Ts data in graph 2 seems to confirm this as no peak signal is generated as of yet..this is to be contrasted with the traditional chartist approaches where moving averages are currently signaling by a cross-over a presumed sell signal...
The sell if it occurs tomorrow will be beneficial in the sense that though perhaps violating the P&Ts if it does occur, it will minimize the up-trend consecutive buys, thus minimizing the over-demand and a potential back-lash in the form of a peak triggered sell-off.
As we felt that the P&Ts are correct at scales of short term cycles' STCs dynamics, and yet the market may sell tomorrow for a down-tick as signaled by chartist approaches, put/call ratios , trader sentiment indicators...etc., we advise caution and staying out of the trade tomorrow altogether, and wait for a clearer signal such as the down-the-road peak-formations or trough formations, both of which will be signal'd clearly and without the increased LTR long term risk cyclicals .
What of the LTRs long term risk cycles ~90days correction or sell-off ...we have discussed how it forms and how it is triggered and how it can be quenched...in practical terms that means 'quenching' short surges of selling during uptrends reducing over-demand and its resulting back-lash or correction or more accurately reversion to the mean levels.
Summary: stay away from the market until a peak is formed and confirmed by our several indicators, next day to three at ~$33.25 (conserv.) if selling does not turn and head towards a trough, a distinct possibility tomorrow as at this critical point near ~90days LTRs, and the manipulation of markets occuring to drive growth uptrends and reduce or quench corrections...in fact unless you 'must trade' stay away from the next week or two altogether until the LTR issue has been settled..there are plenty of high probability high;ly profitable trades available by our P&Ts during non-LTRs periods.
Note: our analytics are scale-able to long-term and during-day 'high-frequency' trading and yet retainin the astonishingly high level of accuracy of probabilities of nonextensive statistics both Wigner random matrix and non-extensive power-law Tsallis types and with derived dynamics of models, a feature most other quantitative models lack..if you require trading signals at other time-scales contact our sales staff.
Forecast 32: 17september2012
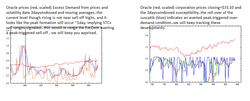
Excess demand from prices and volatility data...the level has yet to (if it will at all) reach triggering over-demand levels...the recent cautious buying of today as an example of a slowdown of 'exuberant' buying may slow the uptrend sufficiently to prevent an over-demand and a triggered sell-off...that is if followed-up on by a selling of 'regular ' magnitudes as of STCs short term cycles magnitudes ~$0.15-$0.30/day average commences tomorrow as is being signaled by other and chartist type of methods..
Forecast 32: 17september2012

Oracle prices (red, scaled) and traditional moving averages...presumably signaling by their cross-over a sell...you will note there is loss of resoluition and de-tracking near highs, however we have moved further away from the roll-over of the up-trend region, and the tracking is presumed to be accurate, it remains to be seen if chartist driven trades will sell tomorrow as predicted, or if the probabilistic P&T excess demand theory which tells us the occurence rates of rallies and sell-offs will out on the morrow, and yet noting that there are major efforts to 'guide' the markets towards a rate of growth whilst quenching of LTRs long term risk events such as sell-offs are being actively put into effects by the major impactors of the markets from fed to market-makers to concerted traders actions...That said, recall that if a rally results from these efforts, it has within it its own sell-offs as dynamics of over-demand and corrections towards the mean are triggered...Also external manipulations are not precisely accounted for by the dynamical theories as they enter as sudden shocks or jolts or perturbations, they are accounted for 'on-the-average' with very high accuracy however by probabilistic methods such as the nonextensive Tsallis statistical ensembles we have introduced in general to finance and the Wigner statistics derived from the random matrix theory of the nonextensive statistical ensembles and which we have innovated in the field of mathematics.
Summary: It is possible to affect the market at specific levels such as run-away up-trends rallies and sell-offs crashes or corrections are quenched...we will see tomorrow if such an intervening effect will occur again. Our best advice is to stay out of the markets until regular short term cycles resume post- LTRs, second best advice to wait until a peak or trough is formed with very high probability then trade, thirdly that you attempt to trade a potential sell-off though we may be able to pinpoint triggering points, noting its inherent high profitability yet with the several large entities presently moving the markets. .
Summary: It is possible to affect the market at specific levels such as run-away up-trends rallies and sell-offs crashes or corrections are quenched...we will see tomorrow if such an intervening effect will occur again. Our best advice is to stay out of the markets until regular short term cycles resume post- LTRs, second best advice to wait until a peak or trough is formed with very high probability then trade, thirdly that you attempt to trade a potential sell-off though we may be able to pinpoint triggering points, noting its inherent high profitability yet with the several large entities presently moving the markets. .
Forecast31: 15September2012

Oracle prices closing=$32.95 14September2012..the 3days windowed P&Ts with averages graph1 and peaks & troughs and excess demand ExcDem graph2 (we're working on trade marking these proprietary indicators..so monikers like P&Ts andExcDem and Suscep. ..if you think of a cutsie marketable name do let us know.. ). The dynamics on this scale are starting to resemble the peak-triggered sell-off we have been discussing...not as worrisome as the at-trough sell-offs or externally triggered news-panic sell-offs as this type of correction or sell-off one can see coming or is signaled 'from a mile away' ,also as this type of potential sell-off of ~7-9% conservatively magnitude can be quenched or reduced to manageable STCs short term cycles-like ~3% selling 'trends' by external re: fed intervention or market-makers concerted action, neither of which we feel is likely to occur at this stage.
The dynamics are those of reversion-to-the-mean -like to put it simply...over-demand as quantified by a demand buy-side surge with a sell-side drop implies (markets can also due to external perturbations wars disasters acts of God and acts of stupid or enlightened humans etc. crash largely or rally largely though 'non-rationally' or markets-unrealistically also, thus the 'implies') a reversion to the mean... this follows subsequently and with a dynamically-consistent inevitability, with expanatory causes ranging from their simplest the desire to reap the gains made by the demand and price surge (a rally has within it the seeds of its own sell-off if you will..), and this in and of itself is a reversion mechanism...add to this the cyclical dynamics of the markets, of cycles within cycles, and we are at the very near-point of the ~90days cycle, and we have yet another dynamically universal feature of stochastic complex systems that exhibit cyclical periodicities including bi-stability or two-or-more-levels of scales transitions, that of stochastic resonance where at certain amplitudes of cyclical timing and noise, a small perturbation is amplified greatly in effect 'triggering' a transition here called a correction or sell-off.
Summary: The trend continued after trough formation to trend upwards, the peak formation has begun(see P&Ts and moving average roll-over and cross-over (blue graph1)) and is expected 2-4days ~$33.10 (conservt.) . The dynamics of this peak formation given its momentum is tocause the very similar over-demand instability that occured ~90days ago and which led to a reversion-to-the-mean or correction or sell-off.
Comment: If shallow sells occur during next 2-4days, it can reduce over-demand and quench the sell-off as discussed..if not then a correction is imminent.
Comment: hypothetically a rally bursting above resistance is 'possible', however that would only delay the correcting reversion effective-forces, and would have an amplifying effect on the correction with higher magnitudes of sell-offs...better to correct now (if not quenched) than to over-rally and over-correct.
Comment: we usually do not go on about the physics of the stochastic complex system that an interacting traders system re: market is, however as we are near a LTR long term risk event, the very problem that inspired a search for physics based answers to the noticed large-scale-transition problem of crashes bubbles and corrections, we feel some detail and background to the dynamics of the problem are appropriate...a mathematical discussion is cited in the referenced papers on our 'presentation of capabilities page scroll down to publications links.
Forecast 31: 15September2012
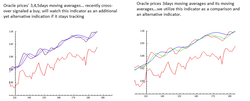
Oracle prices series and traditional moving averages...we utilize these traditional indicators as a comparison and when they do track closely the markets as an alternative indicator at the least of what other chartists influencing the markets are doing.
Forecast 29: 14September2012

Oracle prices closing=$32.62 and 100days graphs...graph1 is the proprietary peaks&troughs indicator 6dayswindowed and averages, which signal'd a 'buy' yesterday and which is indicating an uptrend towards a peak to be formed ~4-5days.The second graph is also P&Ts but with Excess Demand ExcDem (ink) , with similar dynamics predicting trending towards a peak.
Forecast 29: 14September2012

Oracle prices series and 3days P&Ts & moving averages graph1 and ExcessDemand graph2...the current uptrend towards a peak formation is very near the ~90days cycle of Long Term Risk and sell-offs that was noted recently This cycle occurs for several reasons from quarterly fed meetings to quarterly indicators to quarterly earnings, and these cycles' lows have come noticeably after supporting external-to-markets factors such as fed support pronouncements and interventions driven surges in demand have faltered...these are also near volatility ranges transitions towards less-volatile and have been noticed as several cycles within cycles periodicities...the ~90days cycle high (see forecast5 historical graphs) irregardless of the many reasons for its formation is near its peak, 'coinciding' with the current STC up-trend...if a surge in demand as indicated by the (blue) peaks indicator occurs as the sell-side (red) indicator drops to lows, the effect will seem a rally or a bulls surge, however the large over-demand will revert with a correction in prices in a few days, triggered at 'resonance' or peak in the STCs short term cycles' amplitude, a peak-triggered-sell-off. Stay tuned in the next few days as we track this potential development.
Forecast 29: 14September2012

Oracle prices closing=$32.62 moving averages traditional indicators of opportunities of buys and sells in markets..we havbe discussed at length the limitations that these simplistic indicators have especially near historical highs and lows and transitions such as graph roll-overs nearing auch highs and lows, specifically de-tracking and loss of resolution...chartists utilize dseveral types and when one does not track they tend to utilize others and we discussed several and our preferences for traders sentiment indicators over any other such as put/call ratios and consumer sentiment and futures and volatility indexes...the most accurate the traders sentiment as it is a measure of what the market raders will trade irregardless of their rationale, and the other indicators such as put/call ratios limited by accuracy and utilized as a general indication by traders, and consumers usually lagging the trades and reacting to market making events...We also discussed the trader or investor 'confusion' near the recvent roll-over highs in detail.
Summary: we utilize these traditional indicators as a comparison to our proprietary indicators and an alternative when they are tracking the markets with a reasonably accurate resolution.
Summary: we utilize these traditional indicators as a comparison to our proprietary indicators and an alternative when they are tracking the markets with a reasonably accurate resolution.
Forecast 29: 14September2012

Oracle prices series and Excess Demand from prices data graph1 and its susceptability or consensus formation potential graph2, averaged over 3day windows. We are tracking the development of a surge in excess demand driven by external factors..the uptrend is expected to resemble the oscillations leading to the peak-triggered sell-off similar to the dynamics of the preceding ~90days LTR long term risk of days ~897 of the 100days -to-13September2012 graph1 and note we track ~1100days of historical data see forecast5 for example of historical graphs.
Forecast 28: 13September2012
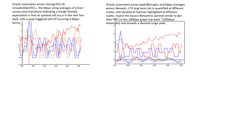
Oracle prices closing=$32.26 and P&T peaks and troughs indicator (blue&red) with moving averages graph1 and with excess demand and its moving averages (ink) graph2...the transition of the troughs (red) indicates the formation of a trough, as does the excess demand and averages... today's signal is a 'buy' , hypothetically and if STCs short term cycles continue to peak-to-trough, an uncertainty near historical highs and LTR long term risk strongly affecting market short term cycles dynamics as the market is currently sensitive to a triggered sell-off, given these caveats the trend should up-trend. We 'quote' ranges conservatively at the extremes of recent trading ranges, and the uptick is expected to be ~$.20 (conservatively) as recent shallow trading ranges are a sign of caution by those excercising caution..
Long term risk LTRs cycles of correction tracking are of importance...we are tracking the highs near the ~90days cycle (see forecast5 historical graph and recent forecasts) and we note that as we move towards the up-trending portion of this STC short term cycle of troughs and peaks that the dynamics resemble very closely the near days ~989 dynamics that led to the at-the-peak triggered sell-off. We expect that aside from the dynamical details of a correction, such as stochastic resonance and excess demand frustrated phase transition -like theories that we have discussed in previous forecasts, cycles of long term risk are due to several factors currently at work, from perception of over-bought markets to 'worrisome' economic factors (fiscal cliffs and lesser ...) as well as the mentioned historical highs near 'resistance' levels.
Summary: the up-trend should commence today, and continue until a peak is formed in 4-6days of ~$32.70 (conservatively) when a sell-off will be triggered of ~7-9%...this will occur unless this current up-trend portion of the STC short term cycle is 'quenched' or reduced in exuberance as a 'rally', a difficult thing near the trading season kick-off and with the fed support intent on driving the market upwards...the sell-off itself will occur for many of the discussed reasons both dynamical and psychological...it can however be delayed in timing and reduced in magnitude to unperceived coirrection at the levels of STCs (from ~7-10% to several ~2-3% from peak-to-trough), by external large perturbations such as inordinate amounts of federal intervention (somewhat expected in the next few days actually) and stochastic feedback control such as market-makers and traders concerted actions (such as disregarding economic dynamical and psychological realities and rallying bullishly irreardless)...
Stay tuned in the next few days, as we will bring you several dynamics analysis from excess demand to susceptibility to re-visiting our criticality and cu,ulative risks indicators, all currently acting up...the 'simple 'view the P&T indicators and moving averages of excess demand graphs1 and graphs2.
Forecast 28: 13September2012
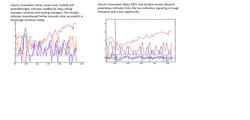
Oracle prices series and 6days P&Ts and ExcDem ..the LTRs are to be viewed at different scales different features become isible at differenmt scales, here 3days and 6days are sufficient to highlight our sought after features of P&Ts peaks and troughs and ~90days cycles.
Forecast 28: 13September2012
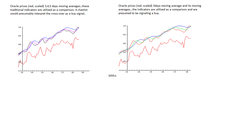
Oracle prices series moving averages..these traditional indicators are utilized by us as a comparison and at times as an additional indication...they are currently signaling what is presumably is a 'buy' as a the indicators cross-over indicating directionality and-or momentum shifts, the signs of directionality chanes or 'peaks' and 'troughs' as discussed by us.
Forecast 27: 12September2012

Oracle corporation prices closing=$32.30 12september2012 100days graphs...P&T peaks & troughs 3day windows and averages graph1 indicate a trough forming today e.o.b. or tomorrow, with confirmation by ExcDem excess demand indicators (ink) graph2. The LTRs long term risk cycles such as ~90days cycles corrections (see forecast5 historical graph) risks are yet with us, and we are tracking the LTR risk which occur with their own dynamics, such as i) peak triggered sell-off (e.x. days ~991) ii) trough triggered sell-off (see previous historical and LTRs forecasts) when sell-side surges with constant yet low demand ...and other similar subtleties yet which appear as surges in the P&T indicators...
The current next LTR risk of correction onset or triggering is most likely a peak triggered sell-off next STC short term cycle peak ...there are several reasons why this is possible not the least of which is the ~90days cyle of corrections recently noted in the markets' timing. Other factors include the previously discussed formed majority consensus of a trend in this case bullish which will appear as a disregard for cyclical forces as the market 'rallies'...at a resonance point amplitude of STCs cycles a small perturbation news real or imagined (interpreted after the fact) impacts the markets strongly, the stochastic resonance at amplitude phenomenon, in this case potentially triggering a sell-off at the next peak STC amplitude formed 5-6days after this trough is completely formed or confirmed...the analogy with a swing set or pendulum that is kicked even slightly at peak swing transferring maximum momentum to the motion is somewhat appropo.
In terms of market psychology from within Excess Demand theory and the amplitude-variance quantification a.k.a. stochastic resonance theory, a sell-off occurs with the majority trending in the peak (rallying, bullish...) or trough direction (selling-off, bearish...) with contrarian minority yet present, and with a triggering perhaps seemingly innocuus perturbation (news) that switches the consensus thereby a sell-off or a rally. Mathematically the cyclical forces in the presence of noise when near amplitude extrema are highly enhanced..therefore small perturbations are amplified' in effect on the system...
Summary: trough forming today, down ~$.30 recent prob. averages per drawdown (conservatively)...expecting next uptrend for 5-6 days peaking with possible sell-off triggered, if triggered sell-off is expected ~7%.
Forecast 26: 11September2012

Oracle corporation (red, scaled) prices closing=$32.31 . The P&T peaks&troughs proprietary indicator (blue&red) signaled a peak two trading days ago, to be followed by STCs short term cycles' down-trend towards a trough formation, the resumption of this on-going STC having been established after a worrisome selling a few days ago (see prices dip and red indicators' repeaed sell troughs formations, and previous several forecasts) posed a danger of a LTR long term cycles' risk of correction and sell-off. The current expectation is that a trough will form between end of trading today and up to two days from now, with sequential down-trends of ~$0.30 in magnitude as recent trading. Barring continuing sell-off at trough (see recent forecasts for lengthy discussion) as we are still near the LTR long term cycles ~90days correction, an uptrend STC will commence upon trough formation which we will pinpoint for you towards what may be the peak-triggered sell-off similar to days ~992 of the 100days -to- 11Sep2012 graph. Visit us often in the next few days and bookmark our pages.
Forecast 26: 11September2012

Oracle corporation prices 100days graph -to-11September2012 closing=$32.31 ..the 3days P&Ts are shown in graph1 with moving averages and graph2 with ExcDem excess demand...the troughs (red) indicator at this scale will continue to transition upwards until the trough is formed, signaled by the P&T 3,6moving averages (6day windows previous graphs) , the ExcDem and its moving averages.
Forecast 26: 11September2012
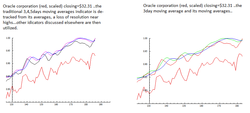
Oracle corporation and traditional moving averages...we utilize these to showcase our different approach as well as to compare predictions.
Forecast 25: 10September2012
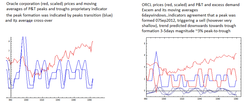
Oracle corporation ORCL prices (scaled) and peaks and troughs indicators.
Forecast 25: 0September 2012

Oracle corporation prices closing=$32.60 and P&T peaks&trough (blue&red) indicator and excess demand ExcDem graph1 100days graphs -to- 07September2012...peak formed 07Sep2012, sell signal was generated, downtrend towards next trough predicted (with following caveats) towards a trough in 3-5days formation same trading range peak-to-trough ~2-3% ...
the short term cycles STCs peak was confirmed by dowtrend 07Sep2012 yet with very shallow selling with prices dropping from ~$32.63 to $32.60 with down-turn established early during the trading day and staying within a trading range until close of trading, leaving the trend towards the trough yet to be confirmed in our opinions as we are very near the highs, and the LTRs long term cycles' risk of correction (see recent forecasts and historical graph forecast5), where will play out one of the following scenarios of i) buy side demand surge peak triggered sell-off (the blue indicator spiking upwards as the red indicator drops as in the graph1 first few days sell-off ) ii) inverted 'effective demand' where sell-side (red indicator transitions slightly upwards..) surges at constant high residual demand (blue indicator remains relatively constant..) and a sell-off is triggered iii) sell-side surges (red indicator spikes..) and with low or decreasing (decreasing blue indicator..) demand, with consecutive sells and at-trough triggered sell-off...these conditions aside from the clear signal of (i) the peak triggered sell-off (see graph1 a few days of the way through...) occur when stochastic feedback occurs as an attempt to control a complex system..that is when entities such as market-makers 'pin the price' near expiry or for example when the fed speaks in support of traders off-quarterly meeting creating 'exuberance' ..meaning when an external perurbation for example adds momentum to a lagging system or creates obstacles to free-market forces, delaying or hastening its downturn, or as intended by policy makers and reported elsewhere, turning a crash large step into a decending staircase of shorter crashes...
Summary: this current STC of trough formation and the next peak is the litmus test for the correction and the results if any of fed stochastic feedback control and other entities' manipulations including traders' calculations of individual risk preferences and market-makers' ....if the correction does not sell-off a comparable percentage as previous ~90 days LTRs, then the effort to quench the correction were successful in the sense that the actual corrections were transformed into a series of smaller downturns yet we predict yet noticeably larger than STCs' peaks&troughs..that is instead of a 10% downturn over 12days correction as in recent LTR cycle, we would have two or three 5% or 3% downturns over a month to a month and a half, interspersed with upturns as stretched out STCs..this warping of STCs is what we are seeing faint beginnings of...as sharp volatility and peaks&troughs is preferred by markets makers it has been reported elsewhere, it remains to be seen if this quenching will out or if the next STC will test it.
Forecast 25: 07September2012
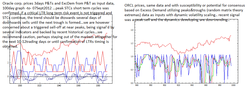
Oracle prices (red, scaled) closing=$32.63 ..the P&T peaks&troughs (blue&red) indicator of short term cycles STCs confirmed a peak and a very shallow selling, which expected downtrend then is yet
Forecast 24 : 06September2012

Oracle prices series (red, scaled) closing=$32.63 . The P&T indicator transitioning to indicate peak formation also indicates a profit making sell opportunity.
Forecast 24: 06September2012

ORCL prices and the P&T shown by itself, graph2 is the skewed averages near-peaks and near-troughs shown in focus..these graphs are at 3day frequency of averaging windows, a good look at higher frequency dynamics when compared to the longer frequencies, next graphs..
Forecast 24: 06September2012

ORCL prices and P&T and averages 6day windows and longer dynamics...the graph1 also is of ExcDem excess demand indicator...confirming near peak transition and a potentially profitable signal to sell.
Forecast 24 : 06September2012

ORCL susceptibility 100 days graphs -to- 06Sep2012 from ExcessDemand and P&T 3,6 day data (graph1,graph2). Excess demand theory derives indicator of price from value and from consensus formation...the susceptibility to such consensus formation is graphed here...the scaling is with volatility, the statistics nonextensive and its expansion(s) as is the P&T and every quantitative analysis of data we showcase...the indicators shown here not as attractive to look at as sell or buy signals as is the P&T indicator, it nevertheless is the most detailed theory of the dynamics of interacting traders and formation of price published and one of the most accurate, its derivation from nonextensive random matrix theory and nonextensive entropy statistics having been shown to track markets price changes with astonishing accuracy.
Summary: Consensus for buying having been formed, the prices trended upwards, indicated by volatility scaled spike in the indicators...gauge impact compared to previous LTRs long term cycles risk and sell-offs from the raphs directly as the previous ~90 day cycle sell-off is prominent.
Summary: we continue to warily track a potential correction...a sell-off triggered by inverted high sell-side surge and low demand has been narrowly averted, or perhaps more accurately the sell-off magnitude has been dampened and delayed by the resumption of the troughs-to-peaks cycles and by an STCs cycle or more..as such the current risk of triggering is an initiated-at-peak classical demand-surged sell-off...we are tracking such, and if does develop it should resemble the previous ~90days ago sell-off, see P&T indicators for more. As always we will keep you updated.
Forecast 21: 05September2012
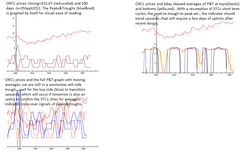
Oracle prices closing=$32.07 100days 05September2012. The current historical highs' related potential correction risk issues continue, elevated risk near ~90days cycles LTRs (long term), and the present possibility of a runaway sell-off a.k.a. a correction similar to days ~1005 graph1,3...see forecast5 for historical graph and recent ~4forecasts for discussions. The previous sell-off correction near days~1005 was a beauty! it marched straight to a peak then everyone panicd and sold. you could see it coming for days, and going for days more, translating the high risk to high profit if the old adage of "timing is crucial to success in the markets..." was available to an investor, and the mission we have set for ourselves.
This time around everyone knows there is a correction in the works, and everyone is 'painfully' (quoted) uptrending cautiously, interrupted briefly by the recent options expiry price 'pinning', and with low volatility highlighting fast selling after short gains...this can not go on for long...either fed pronouncements of support late last week sparked or will spark a bullishness and with optimistic traders returning from their summer vacations(?) adding yet more volatility and volume, or cautiousness and yet with the added volatility will out and translate to selloff or correction towards what the average of risk preferences as a function of market valuation's current levels should be as opposed to what they are...
summary: promises of fixes+optimism = uptrend , reality of the moment and overall fiscally = correction...this is the news driven and psychology driven dynamic of the market.
Quantitatively, cycles exist within cycles and due to many complex reasons ranging from the tradition of traders' summer vacations (therefore reduced volume etc.) to fed quarterly meetings (real and expected centrally controlled rates of interest etc.) to would you believe it solar storm cycles to much more from the seconds-minutes to the months-years what is called several orders of magnitude in time scales...fluctuations (re: noise..) such as are due to reasons ranging from consensus forming about price and its variation amongst n-traders to the much hooplad butterfly beating its wings in Zimbabwe (probably ignorable as a first approximation..) tend to cause fluctuations about the mean, and with therefore reversions about the mean or moving average of actual valuation as opposed to the overpricing of expectations...this implying with a high probability regular and cyclical corrections...these are what we track, focusing on the 'relaxed' investments or trades that are possible on the days-weeks scales...that is as a peak forms, confirmed by several of our proprietary indicators, we quantify the probability of a downtick with a high certainty, as well as its magnitude and similarly when a trough forms. If you require a higher frequency analytics that performs a similar indicator signaling as our proprietary models are scale-able, please contact our sales staff.
Summary: wait for the blue peaks indicator to transition upwards, signaling an STC peak forming next 2-3days if STCs dynamics hold up at similar slight gains low-volatility levels, then note the blue moving average to intersect (or transition towards..see previous 'signals' graph3) to confirm peak formed, that would be a sell signal...otherwise if the cautious selling re-resumes, we will be headed towards dangerous potential sell-off territory with an inverted high sell-side and low excessdemand...as it is, even with a resumed STCs towards a peak, a correction (or several smaller ones) is still likely after peak and we will keep you apprised of developments. Also see our discussion about traditional moving averages indicators next graphs. One more note is that the market is "intended" to go up, it is being functioned to up-trend over the next year though with U.S. debt and international concerns and what have you and despite such concerns...with prime lending rates set by the fed having been at zero for a while other methods such as easing and inflating are being utilized, intended to drive-up equities markets and other sectors utilizing 'now' methods at arguably the expense of the future the intent that productivity and ingenuity and inventiveness will make up for the inflated cost and increase in debt...also recently 'now' released and so-called reliable indicators are signaling an uptrend over the next year yet as slow-downs in highly followed manufacturing indexes continue for several consecutive months...it will be interesting to see what LTRs develop, whether this current correction ~90day cycle will be quenched by trader caution and fed support and what will develop in the future...note that we track best STCs short term cycles, STCs are where the peaks&troughs indicators function best and most reliably and more to the point most profitably...stay tuned folks.
Forecast 21: 05September2012

Oracle corporation higher frequency P&T and Excess Demand or ExcDem ..for comparison with our regular P&T and so that you may gauge development, current danger signs, and to harten yourself as highly accurate signaling for STCs profitability are available!
Forecast 21: 05September2012

ORCL prices and moving averages...we utilize these more traditional moving averages as a gauge for our indicators' resolving power, and every once in a while as a comparison. Many analysts utilize moving averages with some similar or higher sophistication to time trades...as the recent highs de-tracked the indicators' cross-overs a loss of resolving power, it is difficult to say when a buy or sell signal is, and much of chartist trading is being performed by other indicators discussed in our previous forecasts and others not, for example CBOE options put/call ratios, S&P500 volatility indexes, trader sentiment indexes (a very very good indicator if you are willing to pay the subscription) which irregardless of the rationale of the traders does track what they trade in the next few days...a casual inspection even with de-tracked cross-overs would say a sell signal 'near a peak' (excerpted) is about to be made, within a day or three...perhaps prematurely however it looks like STCs are trending towards a peak, it remains to be seen what the impact of such a continuing selling is on the big picture (medium?) of LTRs.
Forecast 20 : 04September2012

ORCL (red,scaled) prices closing=$31.57 100days -to- 04September2012 P&T peaks&troughs (blue,red) graph1 and the skewed averages graph2...aside from the demand side averages rolling over, the skewed averages average rolling over yet still in the bottoms, there is no development from this indicator...as discussed previously, either the STCs short term cycles will resume with an uptrend over a 2-3 (or longer) period of upticks towards a peak formation, or a potential sell-off will be triggered (probably one of two or more for this ~90days LTRl long term risk)...we are keeping an eye on this as it develops and are utilizing several other indicators in conjunction with this one...as it is we expect to be able to i) confirm a sell-off if triggered or STCs if resumed ii) gauge magnitude and duration of STCs and magnitude and duration of potential sell-off iii) pinpoint the bottom if a sell-off, and any false bottoms associated with it and a renewed uptrend after sell-off....see previous LTR data from our several recent forecasts and the several indicators showcased and the predictive power discussed both for previous LTRs and sell-offs and the current developments.
Forecast 20 : 04September2012
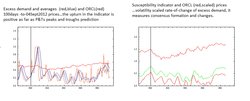
Oracle corp. prices (red, scaled) and graph1 excess demand (a nonextensive statistical phase transition theory similar to magnitization models of phase transition) volatility scaled indicator...current up-trend in ExcDem will give us a clearer indication of any LTR peaks and bottoms as previous LTRs...graph2 susceptibility as the consensus and the change in consensus here scaled with volatility has been at near (recent historical) all time highs, a worrisone indication when the near-highs' (currently) reduced resolution is factored in. However this worrisome trend (see recent LTRs highs and what happened..) is also being looked at in conjunction with several other indicators as discussed.
Forecast 20 : 04September2012

Oracle corporation prices 1107days -to- 04Sep2012 statistics by graph1 nonextensive statistical ensembles random matrix theory and Wigner level statistics and graph2 the histogram of the same data unnormalized for tally of occurences...the very high accuracy of description of stock markets by these statistics (see ref. capabilities page) unlike Gaussian statistics (red, graph1) allows us to quantify with very high precision dynamics and statistics of prices, and to develop indicators such as our P&T proprietary indicators, our ExcDem proprietary indicators, our susceptibility indicators and more...note that aside from introducing nonextensive statistics to the highly accurate modeling of financial markets, both equities AND derivatives in general (not shown..), the derivation of excess demand phase transition theory, we co-authored the fundamental mathematical theory of nonextensive random matrices and the generalized theory of bistable systems. Our showcasing of our capabilities portion of our forecast over, we return you to our analytics and profitability.
Forecast 19 03August2012

GSPC (red,scaled) & CBOE call-put differences (not ratios) data as inputs for excess demand, trying to gauge the market directionality...the cyclicals STCs if they hold up indicate a peak formation in 2-3 days.
Forecast 19: 03September2012
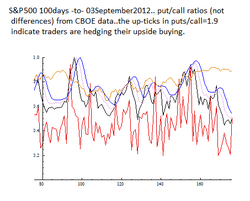
S&P500 put/call ratios CBOE data (not differences)...currently at 1.9 indicates and an up trend expected if the STCs hold up..see previous forecasts for more.
Forecast 19: 31August2012
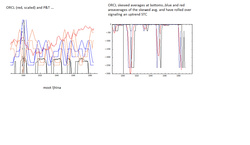
The ORCL prices (red, scaled) closing$31.65 100 days -to-31August2012 graph1 Peaks&Troughs P&T proprietary indicators which measure demand and surges in demand and are correlated by and statistically quantified by nonextensive ensembles random matrix theory and its simpler histogram variant from the demand data, and skewed averages (black)...here shown visually as the P&T indicators (blue&red).
The recent re-drop to LTR long term risk regions on thursday 30Aug and the up-surge transition by troughs indicator (red) was somewhat relieved by Friday's buy uptick..this resulted in a) the trough indicator reforming and 'confirming' a trough forming (near LTR historical highs and the currently messed with disruption of STC short term cycles this is somewhat less than a clear signal). b) the roll over of the averages (red,black) of the skewed averages LTR near-bottoms dynamics graph2 and the roll over of the peaks indicator (blue)graph1...whether this indicates resumption of STCs at least for the short term or a sell-off cmmencing next week remains to be seen though is the dynamic for the STCs.
We ran several tens of scenarios...simulations if you will, of how the next two-three weeks or 12trading days or so will look like...we mention the ~12 trading days as the recent LTRs are approx. ~90days and we are near that (see forecast 5 historical graph)...the most favorable development is that all market-makers resume their bullishness and buy everything in sight until a ~day1005 -like over-bought condition develops followed by a sharply signaled and therefore very highly profitable sell-off occurs (sarcasm...). We are skeptical of this see previous forecasts and comments. We think either a re-instatement of STCs will start monday 03August trending upwards (with fluctuations), or a sell-off will be triggered...irregardless, if STC's re-commence they will only be a short term reprieve, developing towards a peak-triggered or peakless-triggered sell-off fraction of the day ~1005 sell-off, to be followed by one or more similar sell-offs (see historical graph forecast 5) before the LTR bottom is reached, long-longterm cycles not considered as also 'fiscal cliffs' and bubbles better measured by LPOs log periodic oscillations.
Forecast 19: 31August2012
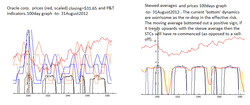
different views of the same graphed data and indicators
Forecast 19: 31August2012
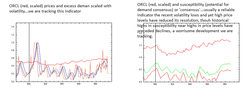
ORCL (red, scaled) and excess demand graph1 and susceptibility graph2...one can readily see the differences between a clearly-signaled sell-off (oh..those were the days, those 90days LTR days..) and the current clearly-muddled perhaps-correction imminent, perhaps not so-imminent (but coming). Note that several conditions exist for a concerted move, high susceptibility which recently has been at an anamolous-in-length highs, a sharp spike in excess demand (it is ~hyperbolically correlated with volatility, and both a buy-off and sell-off 'spike') yet not a persistent one...the anamolous susceptibility may be sufficient for a sell-off, or development towards a peak excess demand may be what is occuring right now..stay tuned we will give you the latest as the scenarios and simulations we have been performing 'play-out'. Note that we intend to provide the i) prediction of onset or ongoing ii) its timing and magnitude iii) its duration and peaks and or bottom(s).
Forecast 19: 31August2012
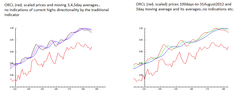
ORCL (red, scaled) prices and traditional moving averages...there are no clear signals during historical highs (and lows) as discussed in previous forecasts.
Forecast 18: 30August2012
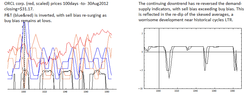
The OrcL price series (red, scaled) 100day -to-30Aug2012 closing price=$31.17 . The P&T (blue&red) continues to be useful as the skewed averages(black)...graph1 shows the development of demand buy side (blue) and supply sell side (red)...the possibility of the correction ongoing we have discussed and are currently tracking. a well managed panic and sell off looks like days~1005. It is preceeded by a spike in demand and then sell-off... an anticipated cyclical correction and with options expiry having 'market-makers' fix prices such that "it is to their advantage to pin the price such that options expire worthless..." (excerpted) looks like the current messed-with near or ongoing correction (take your pick). Even if making the market prices wasn't going on as it is the end of the month, the market makers noticed a cyclical ~90day correction that developed noticeably a year or more ago (see forecast5) and are loathe to correct or be corrected upon. Therefore there is wary sell off and cautious buying by all concerned (are there any unwary stock market investors left with the vast amounts of monies that have recently migrated out of stocks and with economic 'woes'?)..the result is the muddle of inverted or 'effective demand' as sell-side surges at near constant (and low) demand the conditions for a sell-off.
graph2: the skewed averages' bottoms...the consistent though small recent (since that last 'peak' a few days ago) sell offs re-spiked the effective risk measured by the skewed averages. If there had been a buy uptick today, there may have been a temporary reprieve from the heightened risk of a runaway sell-off (the skewed averages would have rolled over and went back up towards demand side)...as it was there was a sell-off and that decreased the indicator to excess supply side dynamics in rapid succession and as graph1's trough indicator re-transitioned upwards indicating a spike in selling...
If as reported elsewhere the options expiry price fixing a.k.a. market making management pins the price at $31.00 friday 31August2012, expect the averages indicators to drop further towards panic triggering sell-off dangerous territory, which would then either occur starting monday 03Sep2012 or thereafter after the artificially created prices lull wears off and short and LTR cycles' reality sets in. Either then the correction sell-off would be confirmed or a faux buy peak will occur. We will keep you apprised. Perhaps more to the point we will be able to i) confirm the correction ii) its magnitude iii) whether as recently there are two or more 'mini' corrections in near succession iv) the real and false bottoms of each one... barring the clear signal of a well behaved panic as our recent ~90day ago sell-off correction and our current messed-with correction or correction-to-be, we feel we may yet provide several profitable opportunities 'informational' forecasts as this develops.
Forecast 18: 30August2012
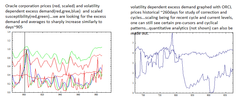
Oracle prices and excess demand and susceptibility and variations for cyclical analysis...we are tracking these indicators as they provide information on large scale transitions re corrections and crashes. See recent and previous forecasts for more details on interpretation and discussion on baclkground..
Forecast 18 : 30August2012
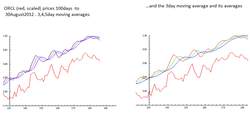
traditional moving averages, at this point of highs and sell following a low peak the averages are not tracking the price STCs.
Forecast 17: 29August2012

Oracle (red) prices series 100days -to- 29August2012 closing price=$31.49. The 'busy' graph1 is of P&T peaks&troughs(blue&red) and skewed averages (black) ...we trade peaks and troughs when confirmed, at the STC short term cycles of ~7-10days from trough-to-peak. We therefore cater our indicators accordingly. If you require higher freq. contact our sales staff.
That said, we are particularly concerned about LTR long term risk...the ~90day correction cycles (see days ~1005 graph1 and previous forecast5 scroll down) is imminent. Barring fed intervention, concerted market makers action as a self-regulating stochastic feedback, it will occur in the next 13trading days if not sooner. We have developed several indicators that attempt to predict and quantify the LTR long term risk and crash dynamics. We have backtested them extensively, yet this is (obviously) a live trial with the inherent risks involved.
Anatomy of a well behaved panic:
a) the P&T dynamics 'spike' near large scale transitions (crashes, corrections..). graph1 days~1005 or ~85 days ago . The demand spikes complacently reaching a peak then crash panic sets in after a larger than expected downturn. This behavior of relieved complacency is known to traders though catches many unawares, and is quantified and verified elsewhere by stochastic resonance theory as a large consensus with a strong contrarian view and an innocuous triggering event causing a flip of the consensus.
b) current intense scrutiny of expected downturn and 'technical correction' crash dynamics by the entire market tells us that efforts are underway to prevent it, anticipate it and so on...this will cause i) delay of crash ii) minization of crash temporarily iii) combination of.
c) the interactions between traders emerges value and therefore price from excess demand theory...this theory from physics (hoy!) is an analogy to critical systems such as phase transition, and this has pre-cursors as indicators of large scale transitions re: crashes and bubbles. Both in polarization of opinion re excess demand theory and susceptibility to consensus. graph2 is a scaled version of this indicator, with weighted excess demand's Log periodic-like oscillations preceding a crash or correction clearly visible even at this scale of months! usually LPOs oscillations have been observed on yearly scale of dynamics in price only! Here we have developed an analogous indicator that tracks the development of the criticality preceding a crash...from inspection, one can note that a crash is imminent. If the intensity of scrutiny and 'market-makers' movements was not at a fever pitch, we would say it would develop simply as the recent 3months ago crash...however intervention means perturbation, and as such modification of dynamics, with the crash in prices resembling previous intensely messed with managed panics of ~6months ago and ~260 days ago (for graphs scroll to more forecast 17). At its most deceptive It will more than likely be damped and if extreme it will be flat to downtrending when the crash onset occurs, with every indicator and its analyst expecting the clear high spike or high low as in ~3months ago crash or if expecting a trough then a peak will precede...the clear and present danger will be when complacency sets in...expect it when you least expect it, and stay tuned, as we expect to be able to i) predict it ii) its timing and magnitude iii) its duration.
Forecast 17: 29August2012
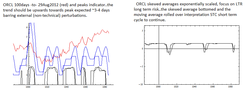
The LTR focus continued...ORCL (red) prices series. graph 1 is Peaks indicator as before and for reference..graph 2 is skewed averages exponentially scaled for bottoms up..note the three 'dips'..the large one is the ~3months ago crash or correction, it is an order of magnitude larger (understated by exp. scaling) and its moving average dips far below its magnitude/duration and indicates its real bottom numerically! The other two clear dips are the recent ~10tradingdays ago unseen mismatch between supply&demand and the "effective demand surge" from what was actually a supply drop at near steady demand, and the current STC short term cycle which we warily eyed as it developed, expecting it to blow up at any moment...however though the danger has not disappeared, the moving average did roll over and dynamically it has begun to resemble an effective demand surge mismatch between supply drop with steady demand as the recent ~10tradingdays ago STC. However we are utilizing these indicators in conjunction, and we remind you of our LPOs -like indicator pre-cursor to LTR above. Also we should note that though we nod at mixing the terminology of crash and correction, the terms crash refer to large long term (years) and corrections to months cycles.
Forecast 17: 29August2012
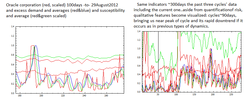
More data as we focus on LTR...graph1 is excess demand&average (red&blue) and scaled susceptibility(red&green) for reference with Oracle corp. prices (red).
graph2 is a ~260days ORCL prices and excess demand with re-scaled susceptibility..a busy graph however if you bring it up you can see more clearly what we referred to in the forecast17 above about the market-makers anticipation and therefore attempts at management of a crash perturbing the crash dynamics.
graph2 is a ~260days ORCL prices and excess demand with re-scaled susceptibility..a busy graph however if you bring it up you can see more clearly what we referred to in the forecast17 above about the market-makers anticipation and therefore attempts at management of a crash perturbing the crash dynamics.
Forecast 16: 28 August 2012
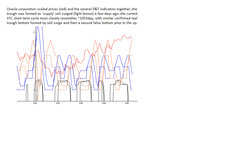
The Oracle corporation prices series (red) ~100days -to- 28August2012 ...note: these are all rescaled plots for easier visualization, closing price ORCL=$31.52... the focus on peaks and troughs indicators (bue&red(ight)) and their averages and the skewed averages (back). Several features are extracted qualitatively from this as well as quantified (not shown)...the large events are preceded by particular statistically quantifiable events such as days ~1005 and ~1054...these proceed in any of severalyet finite dynamics...these can be qualified and quantified(not shown). For interp. and Prediction see graph.
Forecast 16: 28August2012
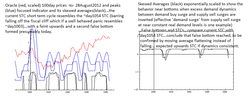
The ORCL (red) prices and focus on peaks indicator (blue),the skewed averages and graph2 the inverted Logarithm scale skewed averages where LTR dynamics are pointed out..note for quantifications(not shown) rates of change and time scales are more of interest. However even qualitatively certain dynamical features can be ascertained...both for the current short term cycle STC of peaks-to-troughs and for LTR long term risk.
Forecast 16: 28August2012
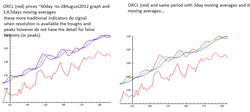
traditional moving averages as indicators of signals. There are two potential problems with this approach...loss of resolution near historical highs and lows and low volatility, lack of precision...add to this the lack of any predictiveness of large scale events associated with LTR long term risk. However we continue to utiize these methods as when they do provide a signal it is worth noting at the least as an additional indication.
28Augu2012...Long Term Forecast News 2

Long term risk LTR analysis 27August2012...the historical cycles as graphed in forecast 5 (scroll down) tell us there has recenty been an ~90day cycle at work in the markets...roughly corresponding to highs near quarterly Fed meetings and lows near the mid point between meetings, it has a detailed dynamics we have quantified in some part. The next 'correction' is coming and we are presenting now some of our analytics re predicting the timing, magnitude and duration of the coming 'correction'. This LTR is to be combined with the forecast 16 and the graph the skewed averages indicators and the pattern of dynamics preceding a 'correction'. Let us go further and say here that unless steps are taken to forestall or delay the correction (this can range from pre-seling by informed traders to external perturbations such as interventions by fed), this current peak STC is a 'possible' (conservatively) pre-cursor to the correction(s)...we base this on the several discussed features in forecast 16 and this LTRnews and previous cited forecasts.
Forecast 15: 26August2012
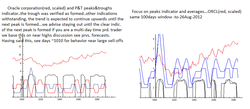
Oracle corporation (red, scaled) and peaks&troughs indicators. The next movement we are tracking is towards a peak and a sell signal for our relaxed trader model which we apply towards the peaks&troughs multi-days cycles...for higher frequency analytics contact us, see our previous freecasts and presentation of capabilities.
Forecast 15 : 26August2012
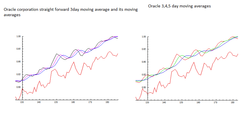
Moving averages, the more traditioinal approach...no indications of sells or buys, near peaks or troughs by this method either
Forecast 15: 26August2012
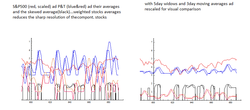
Do you want a winning investment strategy? here is one...the S&P500 (SPX,GSPC) and Hang Seng (HSI) feedback between themselves, at times tracking each other closely, and often lagging by one trading day yet mimicing movement percent identically! The 'trick' then is to quantify this lead-lag and we have done just this...contact us for more subscriber information on this profitable strategy's analytics.
Graphs: S&P500 and the P&T and averages...though less 'sharp' as it is an index comprised of 500, averaging individual P&T's (not shown) improves predictability, and alternative utilizations such as the lead-lag provides for a high profitability.
Graphs: S&P500 and the P&T and averages...though less 'sharp' as it is an index comprised of 500, averaging individual P&T's (not shown) improves predictability, and alternative utilizations such as the lead-lag provides for a high profitability.
Forecast 14: 24August2012
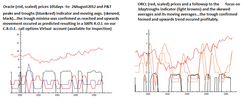
Oracle coropration (red) and peaks&troughs indicators and their moving averages...the graphs captions describe well the simple yet highly accurate predictive power. If you are new to our webpresence, please read our other postings, scroll down for more. Also our brief presentations of capabilities the menu to the left of the webpage.
Forecast 14: 24August2012
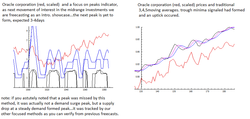
The next peak is now being focused upon by our focus on the peaks indicator excerpted from P&T first graph...2nd graph is the more traditional 3,4,5 moving averages indicator which also signaled the trough minima and a 'buy' signal, though as all users of the method know it is less accurate than desirable and tends to lose resolution and therefore accuracy near historical highs and lows.
Forecast 13: 23August2012
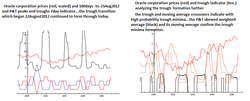
Peaks and Troughs indicator P&T (blue and red) and ORCL prices (red, scaled) 1st graph and skewed weighted averages SWA (black)...the trough continued to form 23Aug2012..has it reached its minima? the 2nd graph focuses on the trough indicator (light browns) and its moving average, and a specialized troughs SWAT...the indications that the minima has been reached and tomorrw a short term uptrend will coommence...this analysis is also based on two factors a) large downturns are preceeded by larger upturns (see 1st graph day ~30) and b) distribution of outliers analysis for current 30day windows (similarly to an 'overall' 1100day analysis) has the probability of >4daysconsecutive downticks at ~1/30 (~3%)and with RMT random matrix theory giving an overall ~5% probability for the same windowed days' price changes. As always one checks premarket sentiment and excercises following controls incase of midtrading day direction reversals.
Forecast 13: 23August2012
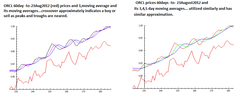
Oracle corporation moving averages and their moving averages...the approximate buy and sell signals traditional moving average analytics is usually sufficient for profitable chartist trading.
Forecast 12: 23August2012

Peaks and Troughs P&T indicator and moving averages indicators as secondary methods during these near historical high times...interpretation..a trough is formed 23Aug2012 short term expected uptrend, similar fluctuations as recent trading range until large transitions occur (statistically, the numbers of uptick or downtick outliers (large magnitude) increases) ...note recent volatility reduction (not shown) and flattening of roll-over of graph tells us that next cycle is coming (a week to two weeks)..or if you prefer look at historical cycles graph Forecast 5.
Forecast 11: 20August2012
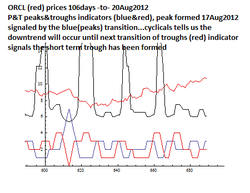
Oracle corporation (bright red) and our useful indicator of the near historical highs moment, the P&T peaks&troughs (blue,red respectively) and weighted averages (black)...the peak was confirmed as selling occured and the graph ticked downwards...the cyclicals tell us that, aside from inter-peak-to-trough ups-downs which though we can track and forecast with reasonably accurate ability (meaning profitably) and which we are not showcasing here, the next transition will be the formation of a trough (and a hypothetical(!) 'buy' signal...) indicated by the upwards transition of the (red) troughs indicator...see recent forecasts postings for further comments on dynamics, directionality and trading range.
Note: as most of our readers are not 'institutional investors' with high frequency daily or more frequent forecasting needs, ,their concern is intermediate time investments of several days, weekly or longer and of LTR long term risk and large events (re: crashes that tend to 'reduce' steadily accumulated profits and gains)...as such our free forecasts are currently focused on this intermediate range and we also are providing LTR risk analysis...contact us if you require a more personalized attention.
Note: as most of our readers are not 'institutional investors' with high frequency daily or more frequent forecasting needs, ,their concern is intermediate time investments of several days, weekly or longer and of LTR long term risk and large events (re: crashes that tend to 'reduce' steadily accumulated profits and gains)...as such our free forecasts are currently focused on this intermediate range and we also are providing LTR risk analysis...contact us if you require a more personalized attention.
Forecast 10: 19August2012 (WF weekend )

Static Peak and Trough indicator P&T unweighted (blue,red respectively) and ORCL prices series (bright red) and skewed P&T averages(black). The transition of the P&T and averages indicates a relative minima, and taken together with the peaks indicator (blue) upwards transition, these are signaling a peak formation 17Aug2012...note a larger uptrend and higher peak (or conversely a downtrend) would also have larger and higher downturns clustered near...the trend as the long term cycles graph has 'rolled over' has been to smaller peaks and troughs temporarily and most likely this transition signals a short term peak 17Aug2012.
Forecast 10: 19Aug2012
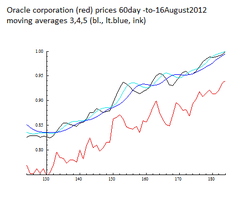
Oracle corporation prices (red) and 3,4,5 moving averages...peak formed between 16Aug-17Aug, confirmed 17Aug2012 by multiple indicators.
Forecast 10: 19August2012
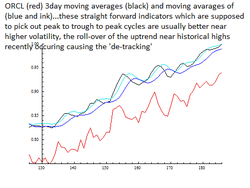
To yet again show the effects of near historical highs..the 3day moving average is graphed with its moving averages...signals (cross-overs) are indicated by these methods, however are they reliable as investors eye historical highs, resistance, and downside risks...a higher resolution method can provide alternative indications...examples of these are the P&T peak&trough and EDTc excess demand theory's various indicators including the susceptibilities (consensus). shown elsewhere in previous postings.
Forecast 9: 15August2012
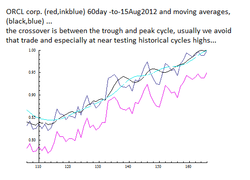
Moving averages and crossover lead-lag signals of highs and lows...
Forecast 9 : 15August2012
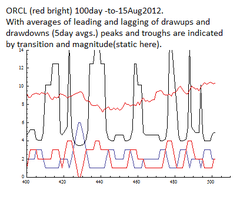
maximum drawdowns(red) and drawups(blue), and ORCL Oracle corporation 100day -to-15Aug2012 (bright red, scaled) ..the peaks and troughs are signaled by transitions, and averages(black) gauge rates and near minima of ratios of drawups to drawdowns...trough confirmed formed 15August.
1) Note that even with this example static graph, large events are clearly signaled, from peaks to troughs...
2) current weather is mild with chances of ups and downs...trough formed 14Aug-15Aug, short term cyclicals say ~4days until the next peak and signal, same recent $range...see graph for details.
3) this method is useful in conjunction with the previously shown approaches, and we will utilize what is useful for the moment, in this case to obtain a differing indicator that does not have the previously discussed 'loss of resolution' of moving averages of daily prices near historical highs.
4) Next week we plan on showcasing a followup to this method, of outliers distributions indicators.
Forecast 8: 14August2012
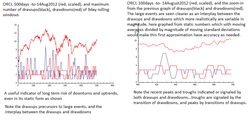
static (not scaled with moving averages and % of standard deviations) graphs of troughs/drawdowns (red) and peaks/drawups(blue) averaged windows graphed with ~1100days and ~100days ORCL (bright red) prices data...the next trough is yet to form, however it should form 15Aug2012-17Aug2012 (16Aug most likely) .
Forecast 8: 14August2012
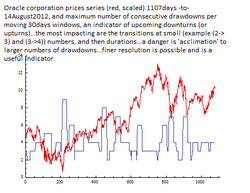
A focus on the troughs/drawdowns (blue) in averaged windows. ORCL (bright red) prices ~1100days -to-14August2012. The transitions signal changes and formations of peaks and troughs, and with dynamic weighting (not shown) reasonably good accuracy of price magnitudes changes can be quantified.
Forecast 8: 14August2012
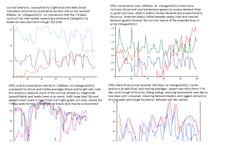
Susceptibility and cyclic analysis (1st graph) and excess demand and cyclic analysis (2nd graph) with prices ORCL (red, bright red). Focus here is on cyclic peak-to-trough and long term risk and large events and historical highs (or lows)...With rescaling dynamically (3rd graph) and inclusion of moving averages indication of a crossover occuring 15Aug-17Aug 2012 (16Aug most likely), supporting other indicators.
Forecast 8: 14August2012
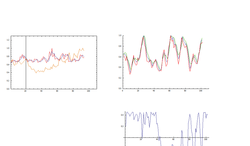
prop. volatility indicators, scaled susceptibility (graph 2) and excess demand (scaled, graph 3)...the focus is on directionality, signaling of peak to trough, as magnitudes are determined by other means...we remind the reader that there are three r's...direction, magnitude and timing.
Interpretation: Near long term cycles highs, excess demand graph3. Volatility prop. indic. graph2 shows bottom formation by 15Aug-17Aug 2012 (16Aug most likely). Moving avgs. scaled consensus susceptibility crossover, indicating leading trough formation.
Forecast 7: 13August2012
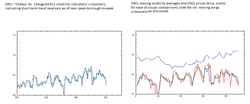
Oracle Corporation..volatility indicators and crossovers as signals or indications of trend reversal, or on the smaller scale than long term cycles, of peak-to-trough-to-peak.
Forecast 7: 13 August 2012
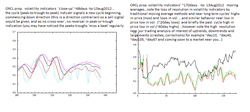
Oracle corpor. volatility indicators moving averages and prop. indic. We show the recent trend and indicators, and zoom-out to discuss the historical cycles and type of behavior vol. indicators exhibit during lows and highs
Forecast 7: 13August2012
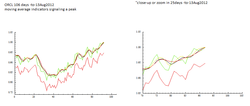
Monday 13August2012, Oracle corporation ORCL 106 day and 'close-up' 27days -to- 13August2012.
An indicator signals a sell. Reminding that near the highs (and lows and graph roll-overs) of historical long term cycles, near resistance and as 'roll-over' of the graph occurs from upwards trending (past ~50days) to perhaps trading range (next two weeks perhaps?) the clear resolution of the indicators becomes less so, adding to investor trading confusion(of buy and sell signals driven), as weighing investor concerns such as "is the market value higher? , will other investors 'agree' and drive value upwards?" become of a more immediate concern.
An indicator signals a sell. Reminding that near the highs (and lows and graph roll-overs) of historical long term cycles, near resistance and as 'roll-over' of the graph occurs from upwards trending (past ~50days) to perhaps trading range (next two weeks perhaps?) the clear resolution of the indicators becomes less so, adding to investor trading confusion(of buy and sell signals driven), as weighing investor concerns such as "is the market value higher? , will other investors 'agree' and drive value upwards?" become of a more immediate concern.
Forecast 7: 13August2012
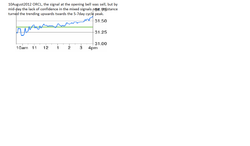
Oracle corpor. 10August2012...the sell at the opening bell and the fizzling out and by mid-day the buy
Forecast 6 : 10August2012

inter trough-to-peak-to-trough cycle we are focusing on, there are smaller ups and downs...add to this investor confusion both institutional and smaller independents....we are capable however of predicting during the low resolution of data and traditional 'signals' utilized to signal sells and buys on computers and for people investors and traders...
Graphs: the 106 day chart ORCL graph and the close-up..note the 'loss of resolution near the long term cycles highs and 'resistance'. However yet a sell signal is generated by this more 'traditional' method.
Graphs: the 106 day chart ORCL graph and the close-up..note the 'loss of resolution near the long term cycles highs and 'resistance'. However yet a sell signal is generated by this more 'traditional' method.
Forecast 6 : 10August2012
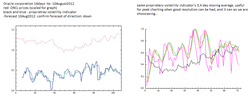
A proprietary volatility indicator (black and blue, first frame) and ORCL prices. The indicator gives magnitude (approx.) and direction...both useful for investing, and perhaps especially during loss of resolution, or to put it another way, near testing resistance. Second frame is ORCL and moving averages of a more traditional approach of moving averages of the proprietary indicator...useful for peaks signaling, note one is yet to form during this trough-to-peak. See previous forecasts for this.
Forecast 5: 09 August 2012
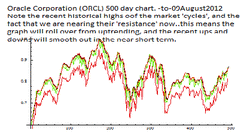
The market formed a shallow trough today and began to trend higher...however we are near the recent historical highs, meaning unless 'resistance' is broken, the 'roll-over' of the graph means less in-magnitude highs and lows for the next few short term cycles.
more 09August2012
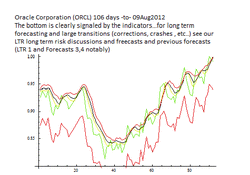
The 106day -to-09Aug2012 ORCL ...note the trough is clearly formed as by our indicators...however as discussed the high long term cycles tells us that investors are confused, and as led by chrtists analysts and forecasters...the reason is as you can see by this chart is the loss of resolution, and as much of the market's movement these days is due to large block investors leading smaller investors to the tune of market signal indicators...when at a loss for reslution, consensus forming then becomes less clear..however short term and long term cycles yet exist, and when analytical quantification of both are made, accurate forecasts can yet be made.
Summary: trough formed 09August2012..however the uptrend is not sharp nor consistent but may meander up and down between the formation of a peak by as early as 10Aug- or after the weekend, 13Aug-14Aug, and turning downwards to form a trough by 15Aug-17Aug (most likely 16August)..uptrns/dntrns ~$.7/30 trough-to-peak and ~$.8/30 peak-to-trough
Summary: trough formed 09August2012..however the uptrend is not sharp nor consistent but may meander up and down between the formation of a peak by as early as 10Aug- or after the weekend, 13Aug-14Aug, and turning downwards to form a trough by 15Aug-17Aug (most likely 16August)..uptrns/dntrns ~$.7/30 trough-to-peak and ~$.8/30 peak-to-trough
more 09August2012
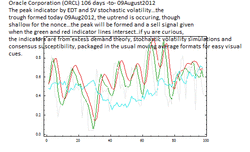
Oracle Corp. 106 days forecast -to- 09August2012
The trough formed today, uptrend is 'on' and the peak will form, and a sell signal be given, when the indicators cross.
The trough formed today, uptrend is 'on' and the peak will form, and a sell signal be given, when the indicators cross.
Forecast 4:06 August 2012
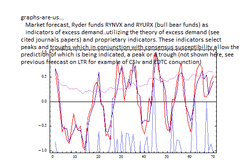
As a showcase of yet another of our capabilities...
We apply excess demand theory EDT utilizing in this example 106days -to- 09August2012 data feeds from RYNVX and RYURX Ryder funds (bullish and bearish respectively that track with and inversely the S&P500)...the analytics indicate the recent peak, the current trough and reformation of the next peak which we discussed...we showcase this proprietary method as our indicators' resolving power, even in times when cycles highs and resistance cause investor confusion.
We apply excess demand theory EDT utilizing in this example 106days -to- 09August2012 data feeds from RYNVX and RYURX Ryder funds (bullish and bearish respectively that track with and inversely the S&P500)...the analytics indicate the recent peak, the current trough and reformation of the next peak which we discussed...we showcase this proprietary method as our indicators' resolving power, even in times when cycles highs and resistance cause investor confusion.
Forecast 4: 06 August 2012
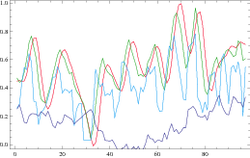
Oracle Corporation (ORCL) 100day graph and week of 06August2012 forecast.
Price peak forming 06Aug-07Aug, Sell signal by Excess Demand theory EDT and Susceptibility will occur ~07Aug-08Aug...trough-to-peak ~$1/30 and upon sell signal at peak, peak-to-trough ~$0.9/30 , with new trough forming ~08Aug-10Aug (conserv.) most likely 09Aug2012.
Risk Long term forecast: There are no extreme events forecasted for this week by Excess demand theory EDT or by susceptibility criticality CSIv (see day ~33day for example and previous LTR long term risk postings for more explanations and data example charts).
O3Augu2012...Long Term Forecast News 1
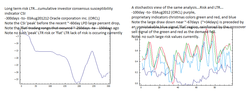
To complement our freecasts, we present or showcase some of our LTR long term risk analysis...to answer the questions of 'what about the risk of a large downturn suddenly occuring?'. Aside from large scale unplanned external-to-markets effects (wars, acts of God, acts of stupid humans...), market rational participants' demand dynamics are currently trending towards higher risk perception, and decreasing demand...these are quantified by our showcased proprietary indicators.
more LTR long term risk analysis, stochastics
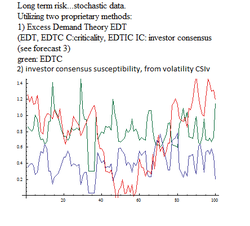
Long term risk...stochastic data.
Utilizing two proprietary methods:
1) Excess Demand Theory EDT
(EDT, EDTC C:criticality, EDTIC IC: investor consensus (see forecast 3)
green: EDTC
2) susceptibility blue: CSIv
-Note, again we see large downturns are 'signaled' by agreement between 1) EDTC and 2) CSIv ...
(see days ~+32 -to- ~+37)...also note we 'offset' the three graphs for ease of visualization.
Red: Oracle corporation inc. (ORCL) 100days prices
premarket 03uly2012
Forecast3: Week 03Augu2012 -to- 10Augu2012
Oracle Corporation
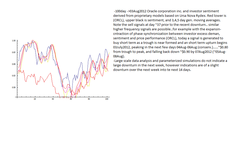
-100day -to- 03Aug2012...(ORCL) (bright red,lower)
Here we showcase with our free week forecast one of our proprietary indicators/signals...utilizing excess demand theory (see cited papers) with RYDEX Ursa (RYURX) and Nova (RYNVX) mutual fund data and generalized signal trenders (upper dark and light red)
we show several buy/sell signals (cross overs) of the high frequency ORCL data including today's uptrend 'buy' signal.
Forecast2: Week 26July2012 -to- 05Augu2012
Oracle Corporation
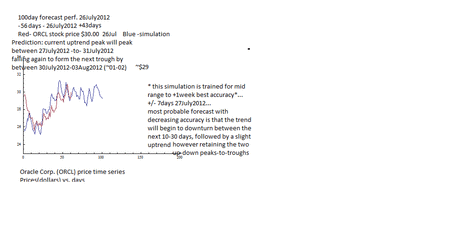
Forecast1: Week 23July2012 -to- 30July2012
Oracle Corporation
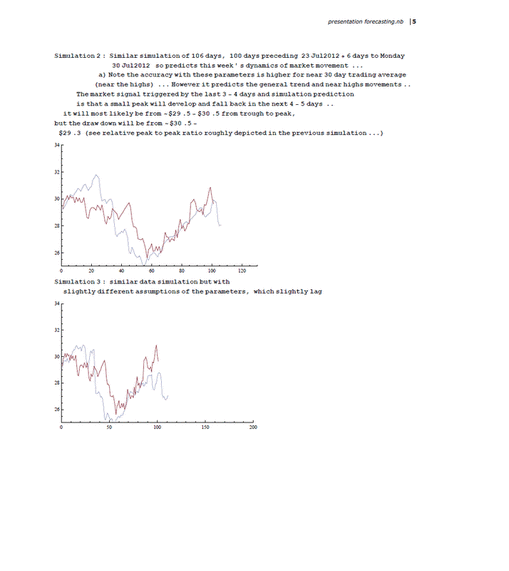
Forecast closing day prices week of 23July2012-30July2012
day 101=23July2012, day106 30July2012
predicts drop in price monday, beginning of draw-up tuesday, peak forming between wednesday to thursday, and beginning to draw down friday through monday. The re-scaled percent of the relative peak (from trough to peak) is conservatively ~$1/30 but can reach the similar magnitude as the previous peak of 20July-25July2012. A straight forward straddle of options, with sufficient time to expiry depending on risk preferences (July expiry is right around the corner so it would be a safer play to go with August call-puts), or of a call-put straddle around $30 with sell calls at the peak and sell puts at the trough will return ~25% returns. A second strategy is to re-purchase Julycalls after selling peak value August calls, waiting to confirm downward move, then selling both remaining options of August puts and July calls for the risk conscious....return ~15%-%20.
