Large Transitions In Complex Random Systems
Long term risk in financial markets and as all economic activity when measured by an index, involves something we know almost nothing about...crashes and bubbles.
We know that crashes occur, and they are potentially highly deleterious to profits presumably accumulated by steady rates of returns. Recent examples of bubbles are the Silver market bursting (...correcting) in 2011, the real-estate bubble bursting in 2009, the recent ~4years economic 'melt-down' in ~2008 of ~50% drop in S&P500 and again in ~2002 for yet nother ~50% drop in S&P500 and again in ~1997 for a~30% drop in S&P500 ...and many many other instances in U.S. and China and Polish stock exchanges and Euro and so on...these actually reported due to vibrant complex systems research groups' interests in studying the exchanges, aside from largeness of economies.
Aside from personal potential for loss of profits, LTR long term risk events on the economy scale are dangerously de-stabilizing, have a cascading effect that reaches broadly throughout economic sectors.
We are nearing such a dangerous time...2012-2013 is predicted to be the next down-turn period...in fact most analysts that only a few short months ago wouldn't mention any such thing have with courageous mentions by CEOs economic leaders and so forth have mustered the courage to repeat the warnings repeatedly sounded by the economic 'fringe'. An economic 'disaster' is imminent. Its severity...magnitude, timing peak and bottom are of interest to us, and we have decided to discuss for the benefit of ours readers the mathematics and physics of crashes and bubbles.
The preferred alarm method is LPOs log periodic oscillations...a 'veritable industry of physicists has grown around LPOs log periodic oscillations' (excerpted) however the subject has remained controversial..
Simply, an interacting complex system with differing organizational features at differing scales transitions between the phases of its features... a ferromagnet transitions from magnetic to non-magnetic, a gas transitions to a liquid and transitions to a solid, and more subtle phenomenon such as an amino acid chain transitioning to a folded biomolecular protein, an amorphous glassy solid from a liquid glass, an abstracted information network transitioning between organizational higherarchies...
A stock market is a 'similar' phenomenon, an interacting network of traders that perform complex interactions all the while faced with uncertainties and perturbing effects of information external and inherent or intrinsic.
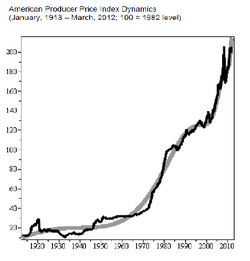
Measuring its output, prices say, over a long period of time, one notes that it goes up say in small increments, however over long periods large changes occur..the graph of observing these large changes also known as crashes, resembles the graph1. The fitting of these precursors to a crash are by Logarithm periodic functions...it just so happens that physically interacting complex systems about to transition in phase display such Log periodic oscillations...therefore, it was conjectured more than a decade ago, there may be an analogy between stock markets and physical phase transitions of complex systems. Several controversies later, it was concluded that a more robust theory of interactions in markets was needed to answer several of the outstanding questions.
An investor needs data and reproduceable estimates of risk...not so much theoretical physics. We will provide you with both, useful estimates , backed by detailed physical theory as we have published it and as we continue to research the quantitative finance subject. Our goal is to warn of the impending crash, which if our warnings as others' does not turn it into a 'non-self fulfilling prophecy' quenching it or preventing it entirely... and efforts are intensely under way by major international figures and organizations from U.S, fed to Asia equivalents...then at the least we can provide you with useful predictions of risk of crash, onset of crash, magnitude of crash, and stages of crash.
The graph1 is of the U.S. "American Producers Price Index" index ~1913-2012 ..it predicts a crash 17th of December 2012...a ~4year 2012-2013 S&P500 crash is predicted by several other not as graph-mathematically oriented methods...are there similar indications to be found in the S&P500?
A general search online shows no researchers predicting a log periodic oscillations signaled or warned S&P500 crash...it seems the wily S&P500 is 'meep meep'ing' us as it did in ~2008 and in ~2002...it is not surging forwards and upwards in decreasing amplitudes of nearing to a crash...or is it!
Long Term Risk measured from S&P500 prices' volatility...The interacting market signal
The S&P500 is an index measuring the emergent price from value decided upon by interacting traders...a physics model of this is similar to a 'magnetisation' model, where consensus by traders is similar to a bar of metal reaching a temperature (variance or its squared root the standard deviation or the measure of volatility ) such that the individual magnets spins (traders bias bullish, bearish undecided) then 'all' (mostly) align to be perceived as an over-all cnsensus trend or 'magnet'. The excess demand is non-linearly proportional to the price and changes in price.
The best way to data this is to interview traders daily hourly monthly etc., asking them their bias...are they bullish bearish neutral...well there are such interviewing servies now, and perhaps in the future we will utilize their data.
There are other data open-sources ...we choose to use the CBOE chicago board of exchange put-call ratio as up-down bias very much similarly to the concept of magnetic spins or here bias...we will present our results in the next few days..
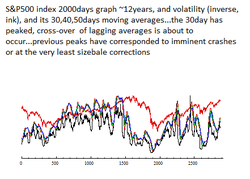
In the meanwhile, note from the simple graph of inverse volatility (volatility decreases to lows right before a crash or correction...this indicative of a majority of traders and investors forming the similar consensus of bullish majority and that shortly followed by a crash!) that there are distinct features ...
1) first of all the market is about to correct or is correcting
2) Log Periodic Oscillations are clearly visible...days 350-600, 1320-1720, 1390-2250, 2300-2450...at these scales, and as the phenomenon is fractal or similar at differing scales presumably (caveat: see previous discussion re controversies between physicists...) , the LPOs should be visible at 10day intervals or such to pick-out the current and recent cycle of corrections.
More so, the recent past ~4years themselves resemble very much a LPOs cycle, with period of the oscillations decreasing towards the counted-down time-to-crash...that is days 1900-2900+present...
Long Term Risk and Forecast by Puts and Calls CBOE Chicago Board of Exchange Data
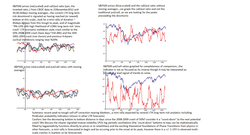
Long term risk by put/call ratio...the current expectation is that the recent correction has neared bottom, and that an uptrend or mini-rally is to occur but with the caveat that LONG long term risk 4-5year cycles are nearing their correcting downturn or 'slow crash' termed such due to the timescale and magnitude with the recent 2008-2009 ~50% drop lasting ~1year...
While the LPOs log periodic oscillations are not directly visible here as they are masked by trend and fluctuations as much of the prices' S&P500 LPOs, they can be extracted by other methods, see our followup postings of results..for now the LTRs forecast is provided for comparison of pour other LTRs indicators.
While the LPOs log periodic oscillations are not directly visible here as they are masked by trend and fluctuations as much of the prices' S&P500 LPOs, they can be extracted by other methods, see our followup postings of results..for now the LTRs forecast is provided for comparison of pour other LTRs indicators.
Long Term Risk and Forecast by Probabilistic Random Matrix Theory statistical dynamics I
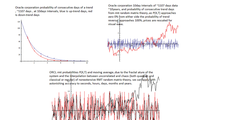
Random matrix theory is multi-scale capably, highly accurate, and hhas been innovated recently in the field of pure mathematics specifically to describe classical and quantum chaos, and complex and random systems (see our papers 'capabilities' page menu to the left)...
Long Term Risk and Forecast by Probabilistic Random Matrix Theory statistical dynamics II
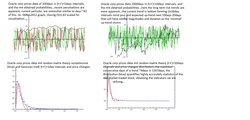
continued...Random matrix theory is multi-scale capably, highly accurate, and hhas been innovated recently in the field of pure mathematics specifically to describe classical and quantum chaos, and complex and random systems (see our papers 'capabilities' page menu to the left)...