Capabilities And Summary Of Quantitative Methods
for more detailed methods, applied to real world markets and prices, see our Free Week Stock Market Forecast section, just click on the link in the menu to the left.
Capabilities and Abilities.
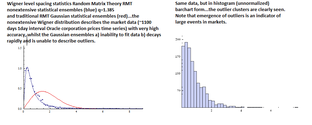
Another of our exclusive capabilities... from our co-authored innovation in the field of fundamental mathematics of statistics...the nonextensive statistical ensembles derived random matrix theory and Wigner distribution of level spacing statistics (blue) (see references and citations of our co-authored papers) , and the traditional Gaussian ensembles' (red) Wigner distribution..We apply our theory for the first time to finance! note the very high accuracy and the complete inability of traditional Gaussian extensive statistics to describing real world market data (ORCL Oracle corporation ~1100 days 1day interval prices time series ..) which is history dependent meaning strong correlations.
Graph 2: the same data graphed in histogram form..you can see the outliers clusters more clearly...
the emergence of outliers having been shown to preceed large market movements or events.
Graph 2: the same data graphed in histogram form..you can see the outliers clusters more clearly...
the emergence of outliers having been shown to preceed large market movements or events.
Markets Directionality Transitions: Peaks And Troughs
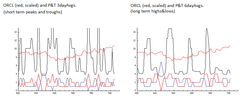
The emergence of outliers and their statistical dynamics in time have been shown by nonextensive RMT random matrix theory and Wigner level spacing statistics to be correlated with onset of large events, changes in trends in markets...and their 'extreme' form crashes and bubbles.
out-statistics from these distributions can be used to track formations of short term peaks and troughs as well as LTR long term risk, as shown here by our proprietary P&T peaks&troughs(blue&red) transitions indicator and skew-weighted moving averages (black). With their simple moving averages these peaks&troughs are one step further in accuracy in predictiveness than simple tyraditional moving averages chartist methods, and represent our starting point of departure from the readily available stock market analytics provided by many stockcharting vendors. These are data inputs as T=#of trend days that with X=$cumulative prices during trend and various other bias indications (market depth, volume, excess demand etc.) form inputs to a precise quantification of probability of an occurence and its reversal (see above qRMT Wigner statistics for example of our claim of precision!).
out-statistics from these distributions can be used to track formations of short term peaks and troughs as well as LTR long term risk, as shown here by our proprietary P&T peaks&troughs(blue&red) transitions indicator and skew-weighted moving averages (black). With their simple moving averages these peaks&troughs are one step further in accuracy in predictiveness than simple tyraditional moving averages chartist methods, and represent our starting point of departure from the readily available stock market analytics provided by many stockcharting vendors. These are data inputs as T=#of trend days that with X=$cumulative prices during trend and various other bias indications (market depth, volume, excess demand etc.) form inputs to a precise quantification of probability of an occurence and its reversal (see above qRMT Wigner statistics for example of our claim of precision!).
Forecasting with accuracy: Now we add probabilities of occurence of #trend days and forecast future direction of trends and their reversals
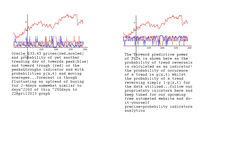
The probability of occurence of a number of consecutive days in an uptrend or downtrend decays near-exponentially or as a power-law... Interestingly this near exponential rate of decay is self-similar across several time scales differing in several orders of magnitude, this having been suggested by some researchers as a self-similar behavior exhibiting a multi-fractals dynamics in stock markets.
This probability p(t) with t=#consecutive days is utilized with the prices derived trend days of a peaks&troughs indicator to calculate the probability of occurence of another trend day, or its converse 1-p(t) the forward probability of a trend reversing! Here recent graphs of this
This probability p(t) with t=#consecutive days is utilized with the prices derived trend days of a peaks&troughs indicator to calculate the probability of occurence of another trend day, or its converse 1-p(t) the forward probability of a trend reversing! Here recent graphs of this
Accuracy Means Profitability!
We have introduced the nonextensive statistics to finance in 2001-2002, we have introduced the nonextensive statistics to derivatives pricing generalizing the Black-Scholes pricing model in 2002-2003 ...our co-authored papers (see references and citations and invited talks and presentations) describe real world markets' prices time series' statistics with very high accuracy, and have provided for
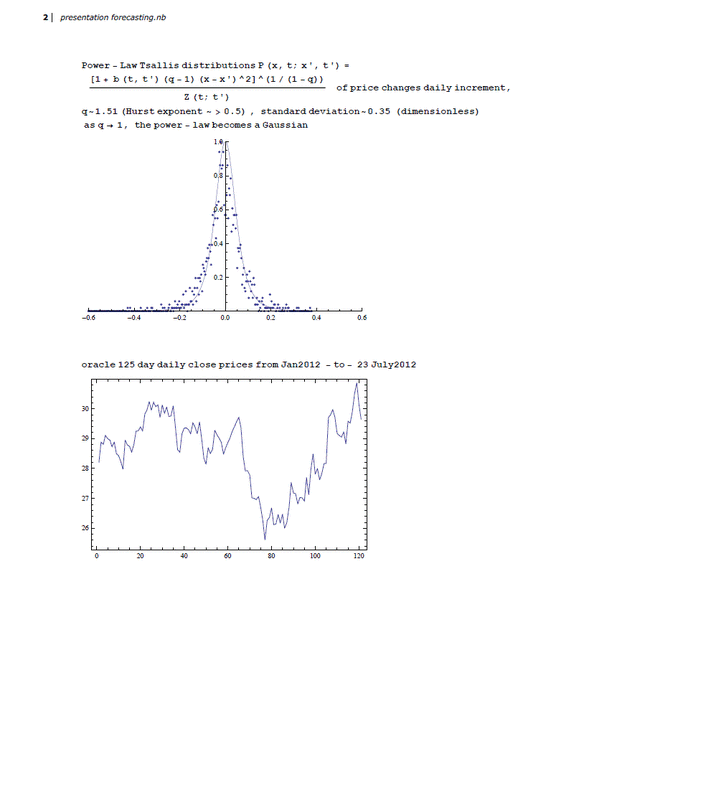
the first time a complete and rigorous description and explanation for the observed fat-tails or outliers of statistical distributions of prices, and their evolution and as a super-diffusion of prices' stochastic time series and by the mechanism of nonlinear feedback between probability statistics and stochastic fluctuations trajectories as selected by investors and traders.
The following graphs show this... the Oracle corporation prices graphed as also increments, then PDF probability distribution by the Tsallis nonextensive power-law PDF...then stochastic simulations as a more 'academic' research area that occasionally produces interesting simulations averaged results for future direction...
for short term we
Excess Demand and crashes and corrections
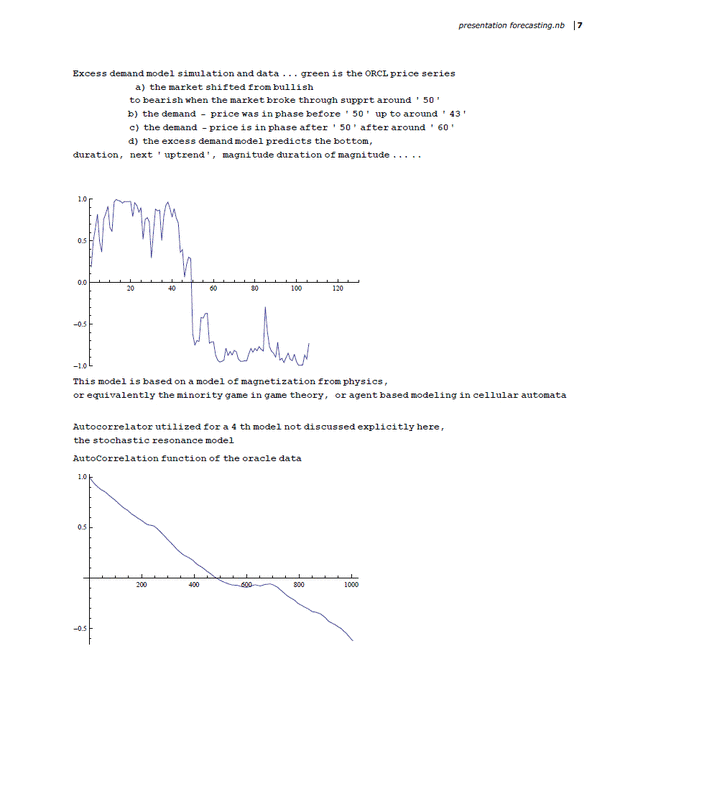
Individual investors have their own bias, of bullish or bearish outlook...when these are taken into account market wide, and the uncertainties and fluctuations due to economic news and variability precisely accounted for by such a statistics as qRMT, highly accurate quantification of demand based directionality can be forecasted....We are not the first to have introduced investor sentiment as a market predictor, however we are the first to have quantified its statistics and dynamics with high accuracy precision and forward predictive power!!
The model is predictive on several orders of magnitude of time, from seconds to years... this very long discrimiation in time scales is due to several organizational scales in markets that have been identified...for example it takes several to tens of seconds for floor traders, computerized algorithms, and auctioneer resolvers to form the immediate price and then to form a trend based on it lasting minutes or longer...it takes several days to form a trend given previous hostorical performance, it takes several years to form a long term trend and an economic trend with other scales not mentioned such as intermediate scales of hours.
Several data types can serve as input to determine market bias or excess demand, with excess demand proportional as with market depth to price...these range from trend strengths of trending days such as peaks&troughs differences and with cumulative prices and volatilities, to investor sentiment surveys (readily available ) to put/call ratios' data as calls-puts differences as a measure of bias... interestingly these provide very similar results, and given the accuracy of the statistics utilized and coupled with a precise quantification of associated risk and a converse+probabilities of trend reversal, forward forecasting is possible at a level of predictiveness never before possible. This meaning across several scales of self-similar time from high-frequency inter-day ranging to the time scale of years as discussed.
Sample graphs of Excess Demand I
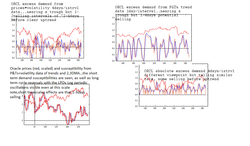
Excess Demand and investor susceptibility to consensus formation dynamically graphed....the rate of change of the excess demand with volatility is the analogous susceptibility...if this terminology sounds familiar to you it should, as it is phase transition theory from physics however utilizing nonextensive statistics a revolution generalizing exponential(Gaussian) Gibbs-Boltzmann statistics to super-exponential(power-law) Tsallis-Zanette statistics and the somewhat lacking description of complex interacting systems' statistics by (Gaussian) Wigner extensive RMT to Evans-Michael nonextensive (power-law derived) )Wigner qRMT.
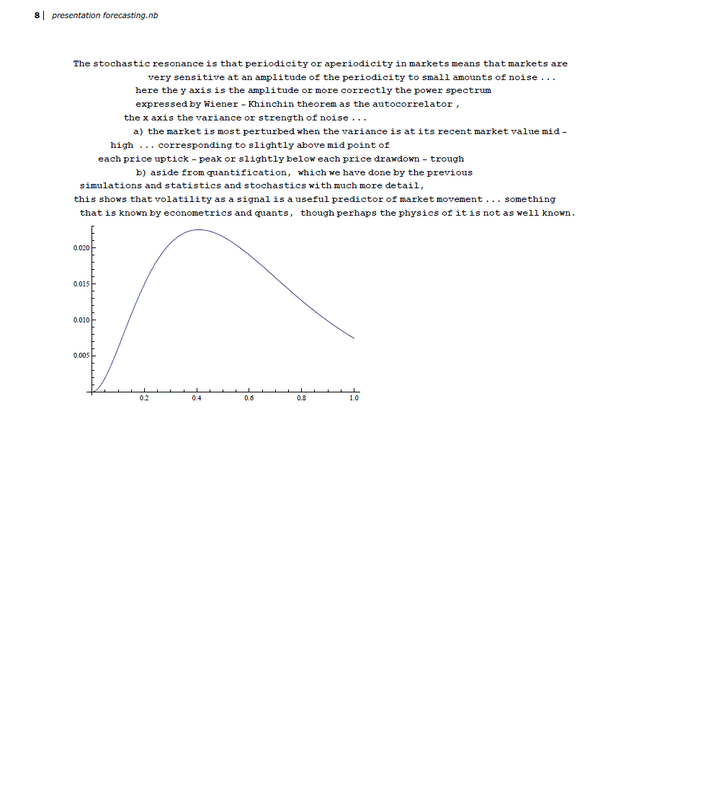
Why does a seemingly small news snippet often trigger a large market panic: Stochastic Resonance derived Criticality indicator I.
It is known that nearly cyclical systems that have nearly regular ups and downs but with fluctuations exhibit a phenomenon of sensitivity to small perturbing effects...that is where a small news story triggers a panic to sell or a rush to buy in stock markets for example. This phenomenon where small pushes cause large moves as a response when timed correctly at peak sensitivity is a phenomenon known as resonance, and with uncertainties included it is known as SR stochastic resonance...we are actively developing criticality indicators from this method to predict vulnerability of markets to small changes, vulnerability implying heightened risk monetarily. We are currently coding the indicators and their associated graphing, based on the stochastic resonance graph here shown.
Time dependent criticality from bias and bi-stable systems (transitions between two scales say bullish to bearish corrections...) theory: Criticality indicator II.
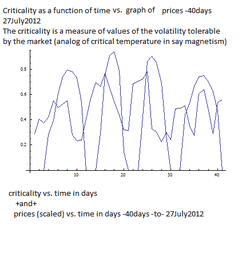
criticality as a function of time...criticality is similar to Tc critical temperature in magnetization models, with nonextensive excess demand a generalized phase transition -like theory and Tc being replaced by the critical variance from volatility calculations.
Note we graph a medoum time scale here (thus the double peaks inside a single criticality envelope) and that this simple mean-field like model captures the essentials of trend reversals. We are ofcpourse developing a more sophisticated detailed criticality model based on our discussed statistical and dynamical approaches...stay tuned in the next few weeks as we add this indicator to our proprietary set of indicators.
Note we graph a medoum time scale here (thus the double peaks inside a single criticality envelope) and that this simple mean-field like model captures the essentials of trend reversals. We are ofcpourse developing a more sophisticated detailed criticality model based on our discussed statistical and dynamical approaches...stay tuned in the next few weeks as we add this indicator to our proprietary set of indicators.
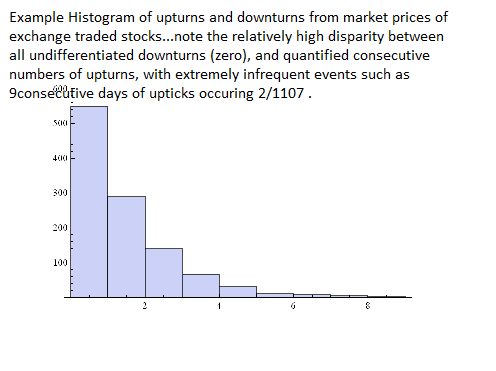
An example of distribution of trend days
example of trend days distribution in histogram form... we do not show the super-exponential decay envelope function.
http://www.unifr.ch/econophysics/paper/show/id/cond-mat_0108017
http://www.unifr.ch/econophysics/paper/show/id/cond-mat_0204261
http://www.unifr.ch/econophysics/paper/show/id/cond-mat_0204261
http://www.unifr.ch/econophysics/paper/show/id/1004.1804
http://arxiv.org/find/grp_q-fin/1/au:+michael_fredrick/0/1/0/all/0/1
Also see publications references contained in our linked articles..for the actual Journal peer reviewed publications, conference presentations, invited research speaker requests at international conferences and the published conference proceedings, please contact fnmfnm2@yahoo.com (773)512-3088.
http://www.unifr.ch/econophysics/paper/show/id/cond-mat_0204261
http://www.unifr.ch/econophysics/paper/show/id/cond-mat_0204261
http://www.unifr.ch/econophysics/paper/show/id/1004.1804
http://arxiv.org/find/grp_q-fin/1/au:+michael_fredrick/0/1/0/all/0/1
Also see publications references contained in our linked articles..for the actual Journal peer reviewed publications, conference presentations, invited research speaker requests at international conferences and the published conference proceedings, please contact fnmfnm2@yahoo.com (773)512-3088.

